Past IEM Features tagged: drought
Back to Last July
25 Jul 2025 05:30 AMThe weekly update to the US Drought Monitor was released on Thursday and the impact of a wet June and now July has nearly eliminated all analyzed drought within Iowa. The featured chart presents a time series of weekly analyzed drought coverage since the start of 2023. We are pretty much back to the same situation we were in last July with the rapid removal of accumulated dryness. More precipitation is in the forecast along with a return of hotter temperatures by next week.
Voting:
Good: 16
Bad: 0
Tags: drought
Continued Drought Improvements
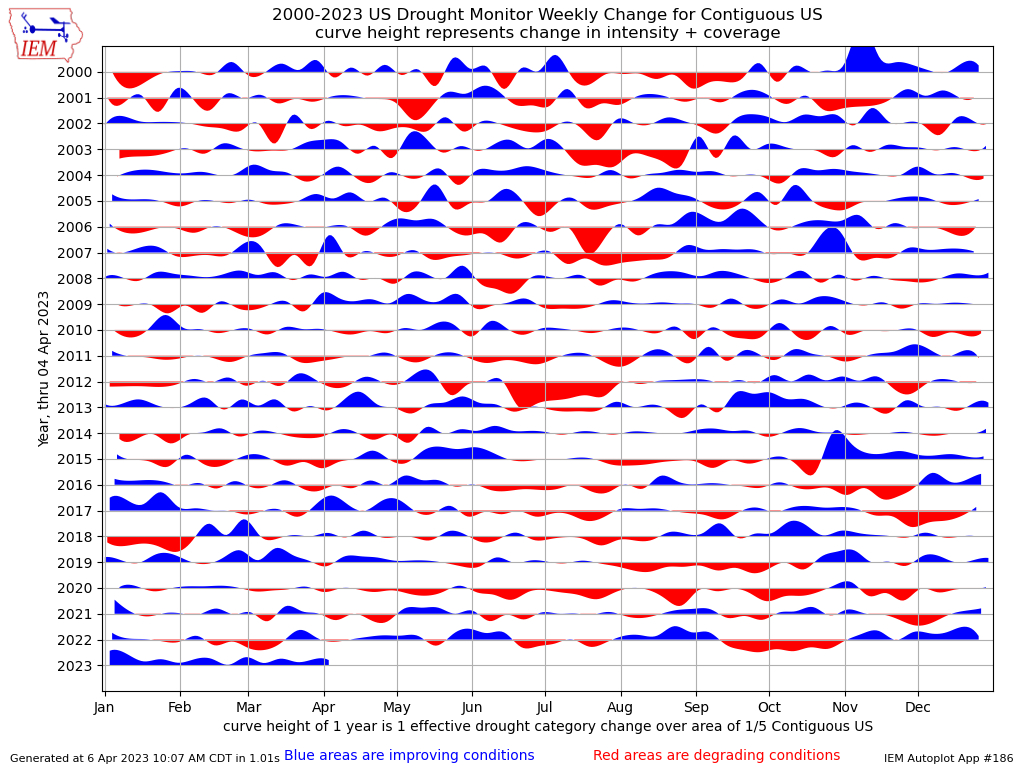
07 Apr 2023 05:30 AMThe weekly update to the US Drought Monitor was released yesterday and continued to show overall improvements to analyzed drought over the United States. It has been quite the cold season with numerous "atmospheric rivers" slamming the west coast and record amounts of snow / precipitation over areas of the Midwest and western US. The featured chart presents a smoothed analysis of weekly change in drought coverage over the contiguous US. The magnitude of the filled areas represent the relative amount of change in drought coverage. A unit height represents 1/5th the area of the contiguous US. Since 1 November 2022, we have seen near continuous improvement in drought coverage.
Voting:
Good: 13
Bad: 0
Abstain: 1
Tags: drought
Iowa D4 Drought
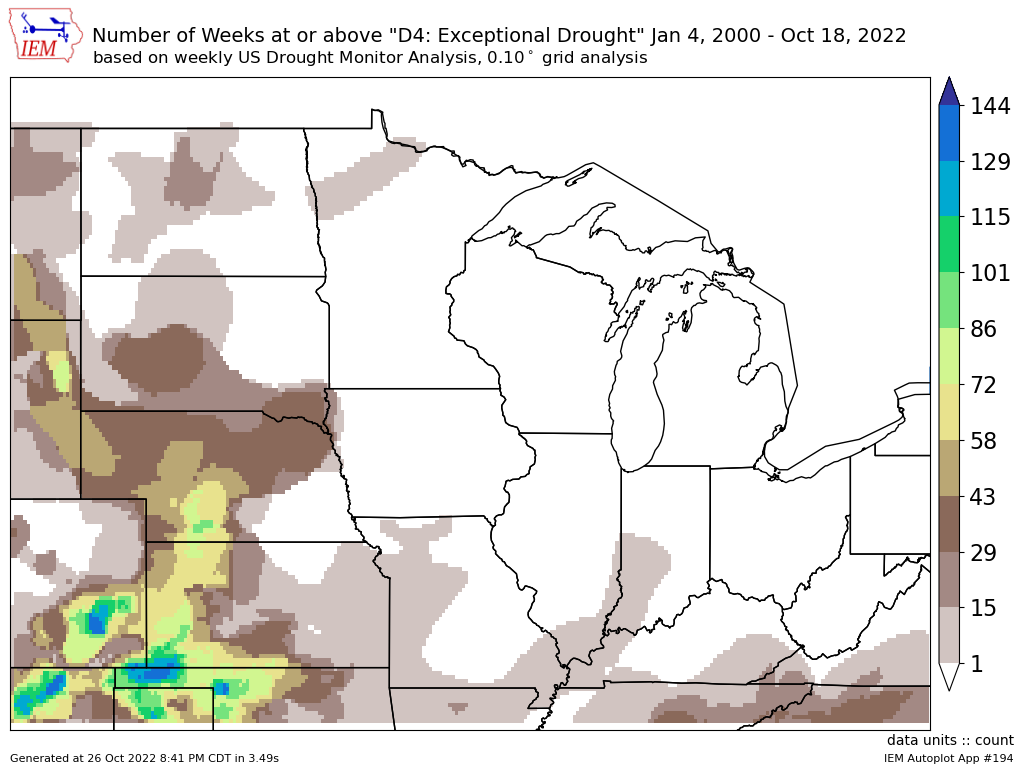
27 Oct 2022 05:31 AMFor the past number of weeks, analyzed D4 drought classification (the most intense level) has been just off to Iowa's west in Nebraska. This week's update is due out later this morning and will be interesting to see if D4 has made it into Iowa. Having D4 drought in Iowa is extremely rare as shown by the featured map presenting a raster analysis of number of weeks spent at D4 classification since the inception of the drought monitor in 2000. Only the most extreme portion of far northwestern Iowa and a sliver of Iowa's southern border have seen D4. It seems possible that D4 could eventually creep further into northwestern Iowa than in previous years with dry weather expected to persist into early winter.
Voting:
Good: 12
Bad: 1
Tags: drought
Low Mississippi River
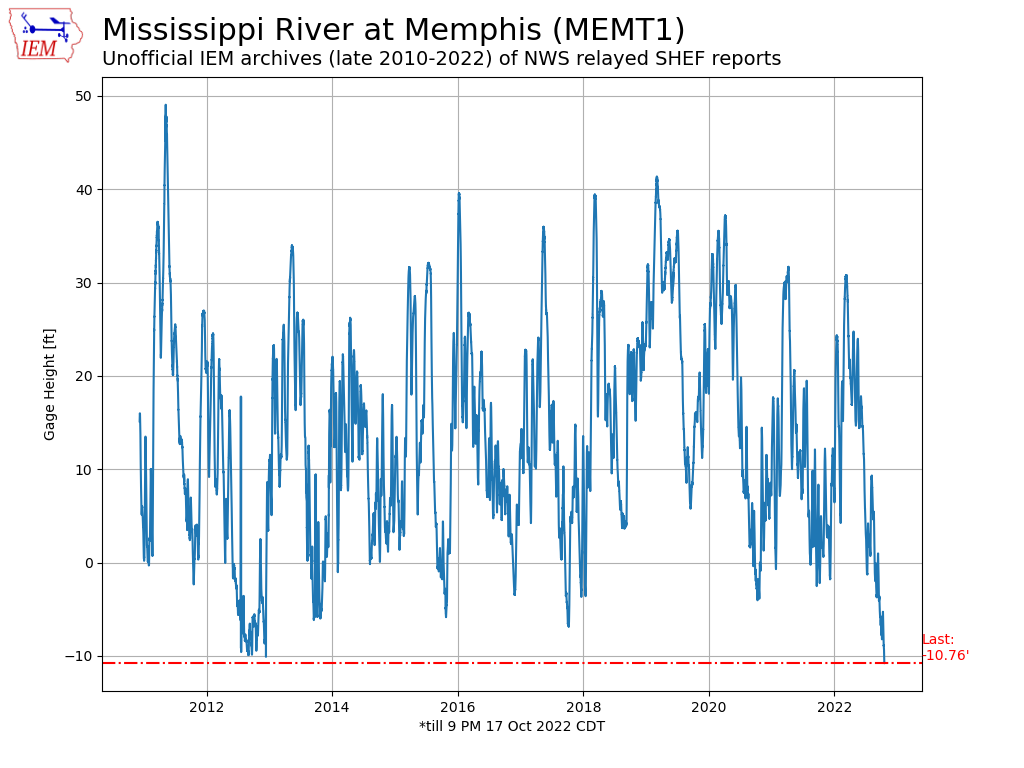
18 Oct 2022 05:30 AMThe ongoing drought is having a very significant impact on water levels along the Mississippi River. The gage height reported by the Memphis, TN sensor hit a record low value on Monday at -10.71 feet, which bested the previous record low stage set in 1988. The IEM has archives of these river gage reports, but only back to late 2010. The featured chart presents the gage height reports for the site with the red line representing the value at 9 PM Monday. You can see the current value dipping below the low flows during the drought of 2012. A major impact is reduced barge traffic, which is important for moving agricultural crops from Iowa to elsewhere.
Voting:
Good: 13
Bad: 1
Tags: mississippi drought
Different Droughts
26 Aug 2022 05:30 AMProducing a drought analysis is very tricky business as generating a single classification that encompasses precipitation departures over various time scales is fraught with peril. It also does not help that summer time precipitation tends to be very spatially variable as individual thunderstorms have a footprint much smaller than what the drought monitor is built to capture. The featured map attempts to illustrate this by combining the most recent drought monitor analysis and climate station precipitation departures measured over 30, 120, and 365 days. The departures are expressed in terms of standard deviation (sigma) and colored in a way that aligns with a drought monitor classification metric. So a comparison is readily apparent between the drought situation in NW Iowa and that in southern Iowa. The bulk of the significant dryness in NW Iowa is on longer time scales and southern Iowa is a much more recent / flash drought situation. In the face of conflicting precipitation metrics, it is always good to look at impacts. In this case, low river flows, dry soils, and crop stress are generally common over all the analyzed drought areas.
Voting:
Good: 23
Bad: 0
Tags: drought
Drought Timescales
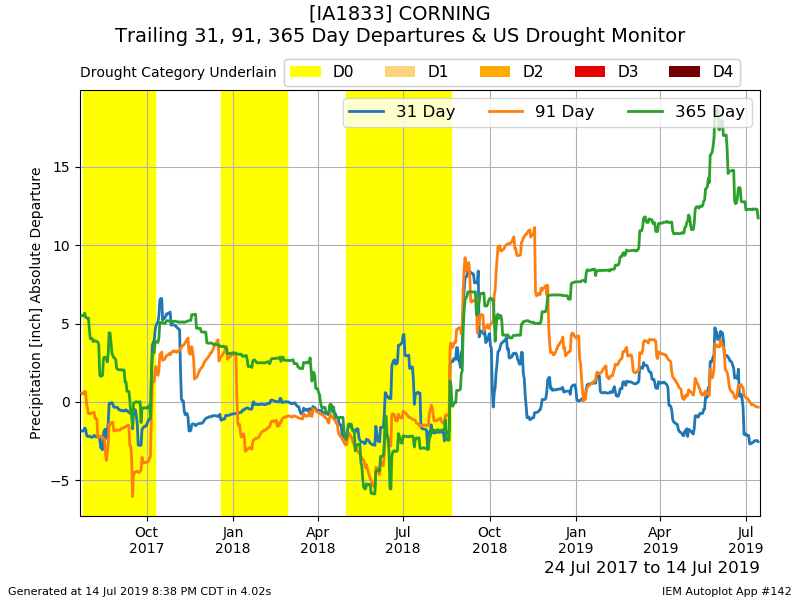
15 Jul 2019 05:34 AMAfter a very wet spring and one of the wettest 365 day periods on record for the state, recent dry and hot weather has concerns of drought back on the radar. The featured chart depicts trailing day precipitation departures and the analyzed US Drought Monitor for Corning (southwestern Iowa). Focusing on the most recent data, one can see a very large difference between near term (31 and 91 day) precipitation departures and that of the past 365 days. Such large differences like these are currently common over much of southern Iowa with reports starting to trickle in of water stressed crops. Given the current forecast, having drought officially analyzed in the state again does not appear to be far off.
Voting:
Good: 14
Bad: 0
Tags: drought usdm
D3 Drought Frequency
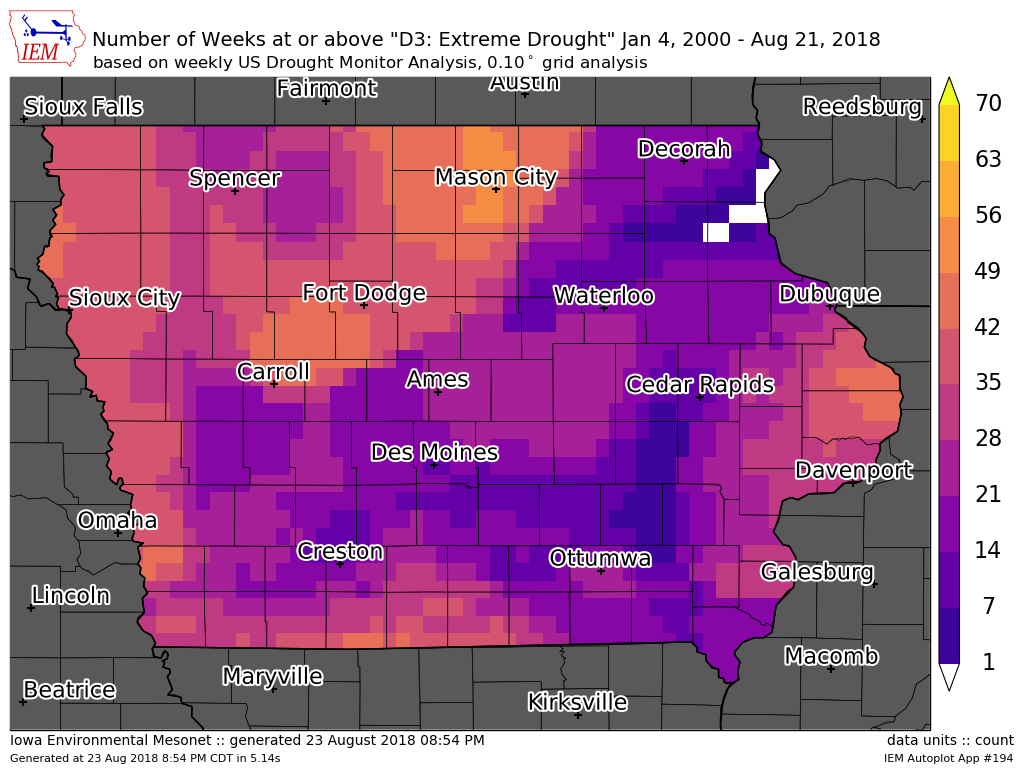
24 Aug 2018 05:34 AMThe weekly release of the US Drought Monitor was yesterday and it showed a continuing degradation over southern Iowa. The area analyzed as "D3: Extreme Drought" was expanded slightly. The featured map looks at the frequency expressed as number of weeks since the year 2000 that a given location was at D3 or worse drought status. There is a sliver of white shown over far northeastern Iowa, which indicates no D3 was present since 2000. If this map was expressed in percentage of all weeks, values would be less than 5%. This level of drought is not all that common in the hence, hence the Extreme label.
Voting:
Good: 11
Bad: 1
Abstain: 2
Tags: drought
Full Year of Drought
08 Jun 2018 05:34 AMThe drought situation in Iowa continues to be of concern as significant rains for May and June have not panned out for all parts of the state. For much of southeastern Iowa, the US Drought Monitor has maintained at least D0 status for nearly the past year. The featured map depicts the percentage of weeks since 13 June 2017 that a given area was under any classification of drought (D0 and higher). The 13 June 2017 date was chosen as it was the first significant coverage of drought last June after the rains of May 2017. So the situation this year is a bit different than last with persistent drought in the area going into the heart of the growing season. You can generate this map for other states and time periods of your choice.
Voting:
Good: 12
Bad: 1
Tags: usdm drought
Drought Improvement or Degradation this Spring?
16 Feb 2018 05:34 AMThe newly released US Drought Monitor this week showed a bit of improvement over Iowa thanks to the numerous recent rounds of snow storms. The featured chart looks at the weekly change in drought coverage over Iowa since 2000. The unit height represents a one category change in the coverage of the Drought Monitor over Iowa. Placing aside the difficulty with those units, the blue sections would indicate improvements and red degradation. What's interesting to note in this chart when we think about what may be happening this spring is that having further degradation during the spring season is rather rare. Only 2015 during the past 15 years experienced significant degradation prior to the first of May. So it will be interesting to see what happens this spring!
Voting:
Good: 10
Bad: 3
Abstain: 2
Tags: drought usdm
Increasing D1 Drought
14 Jul 2017 05:35 AMWhile yesterday's IEM Daily Feature discussed flooding rains in one part of the state, today's feature discusses the worsening drought situation for other parts of the state. The featured chart displays the weekly coverage of analyzed US Drought Monitor condition in the state since June 2016. The D1 (Moderate Drought) category was expanded over the state this week. The current near term forecast is not very optimistic for needed rains over the dry areas of the state.
Voting:
Good: 12
Bad: 0
Abstain: 1
Tags: drought
Worsening Drought
24 Jun 2016 05:34 AMThe latest US Drought Monitor was released on Thursday and it depicts a worsening drought situation in Iowa. D1 "moderate" drought classification was introduced over a tenth of the state this week. The featured chart displays the weekly areal coverage of analyzed drought in the state since 1 Jan 2015. This is the most D1 classification coverage we have seen since then. The most recent drought monitor update was prior to some rains this week, but some of the driest parts of the state missed out on these.
Voting:
Good: 15
Bad: 0
Tags: drought
Drought Timeseries
20 Mar 2015 05:41 AMA very dry March and below average snowfall over the north has prompted the US Drought Monitor to analyze parts of Iowa in D0 drought designation. The featured chart displays the areal coverage of drought in Iowa going back to 2000. Drought categories increase up to D4, which was found in Iowa back in 2012. With no crops in the ground and today being only the first day of spring, the drought impacts are currently limited to hydrological issues like stream flow.
Voting:
Good: 37
Bad: 8
Abstain: 10
Tags: drought
Drought Changes
10 Jul 2014 05:40 AMThe wet month of June has mostly eliminated the drought situation in Iowa as analyzed by the US Drought Monitor. This monitor product is updated weekly by a national team of experts and depicts various intensities in drought. The featured chart looks at the weekly changes in this analysis with blue lines being improvements and red lines are degradation. It will be interesting to see if this July/August follows the previous three years with drought quickly developing after the heavy rainfalls of spring and early summer subside. The length of the arrows indicate a relative intensity change with the unit value being an equivalent one category change over the area the size of Iowa.
Voting:
Good: 10
Bad: 2
Abstain: 4
Tags: drought
Drought Hole
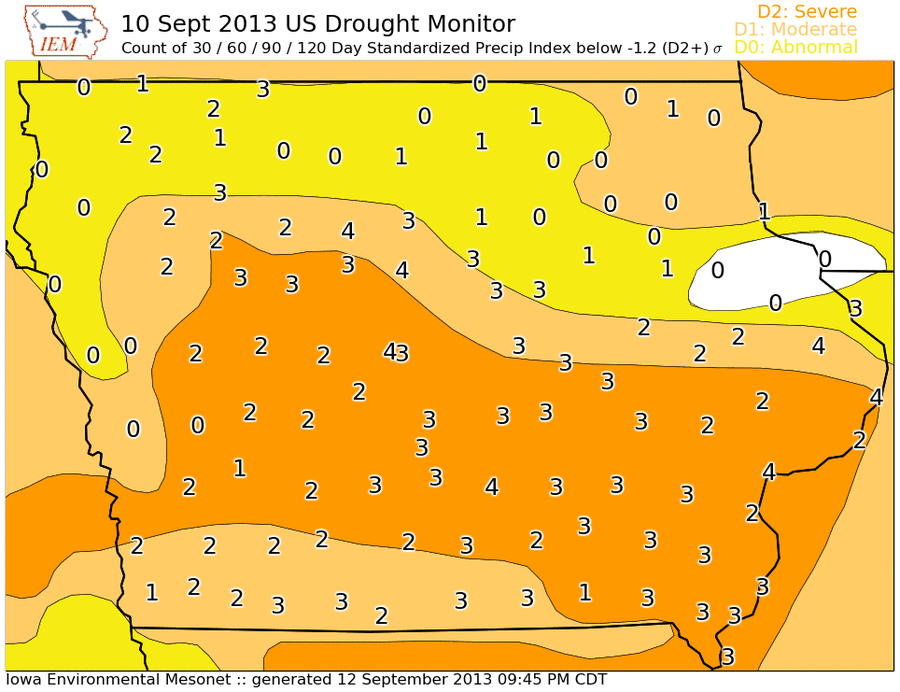
13 Sep 2013 05:44 AMThe United States Drought Monitor is a hand drawn analysis of weekly drought condition in the country based on quantitative and qualitative measures of drought. The featured map shows the most recent analysis valid on the 10th. The entire state except about two counties is shown in some level of drought condition. The plotted numbers are IEM computed counts of the number of recent periods having a precipitation departure of at least negative 1.2 standard deviations from average. Four periods are shown covering the recent 30, 60, 90, and 120 days. So if a location has a four plotted, each of those periods has a precipitation departure worse than negative 1.2 sigma. The negative 1.2 level is about when "D2" drought is to be analyzed. The numbers show the most consistently dry areas of the state are from central to southeastern Iowa. Northeastern and extreme western Iowa have not been as dry.
Voting:
Good: 202
Bad: 29
Tags: 2013 drought
Drought creeps back
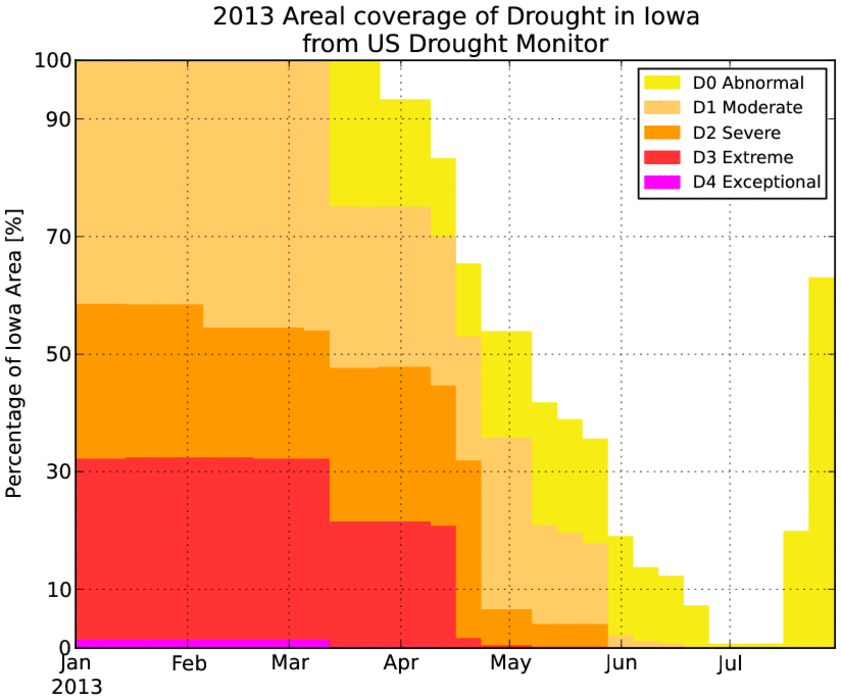
26 Jul 2013 05:36 AMThe precipitation gains made this spring to practically eliminate the drought condition in the state are being lost thanks to a dry June and July. The featured chart shows the percentage of the state covered by analyzed drought condition from the National Drought Monitor. The most recent update to this analysis has over 50% of the state now covered by abnormally dry condition (D0). The good news is that there have been recent rains, but the heaviest totals have mostly missed the western half of the state. More chances of rain are in the forecast, but the heaviest totals will be to our south and east.
Voting:
Good: 63
Bad: 6
Tags: 2013 drought
Making up deficits
05 Jul 2013 05:39 AMThanks to a wet spring and June, Iowa made up its 365 day precipitation deficit from the drought of 2012. The featured chart presents some metrics related to making up this year long precipitation deficit. The top panel displays the daily rate the deficit was made up as measured from the date with the largest deficit to when the deficit was erased. The second panel displays the number of days it took for the given deficit to be erased. The bottom panel displays the depth and time of each period since 1900 with a deficit for statewide precipitation. This year's deficit bottomed out at 9.18 inches on 26 Jan 2013 and was erased on 24 June 2013 (red items on chart). The chart shows that once the long term deficit reaches four or more inches, it will probably take three months or more to recover.
Voting:
Good: 227
Bad: 18
Tags: precip drought
Worse than last year
26 Apr 2013 05:41 AMThe heavy rains of April have improved the drought situation in the state considerably, but the featured chart shows that Iowa is still slightly worse off than last year at this time and in the worst condition since 2003! The precipitation deficit accumulated from last year will not be made up for in a month, but will take more wet months to come. The immediate term forecast looks warm and dry, which will help the crop planting progress in the state.
Voting:
Good: 143
Bad: 20
Tags: drought
Weekly Drought Monitor
09 Nov 2012 05:35 AMThe US Drought Monitor is released weekly and provides an analysis of drought conditions. The featured image displays the week to week change of the drought monitor product over Iowa since January 2000. Drought is classified from a D0 to D4 category. The length of the arrow represents the areal change in combined drought categories. For example, if the entire state went from a D0 to D1 category then the arrow would be one unit long and in red. In this case, the unit length is shown on the y axis as one year. The bottom row of arrows are those for 2012 and clearly show the degrading drought situation that occured during July. The last three weeks of October 2012 have seen some improvement, but there is still a ways to go.
Voting:
Good: 18
Bad: 12
Tags: drought
When did the drought start?
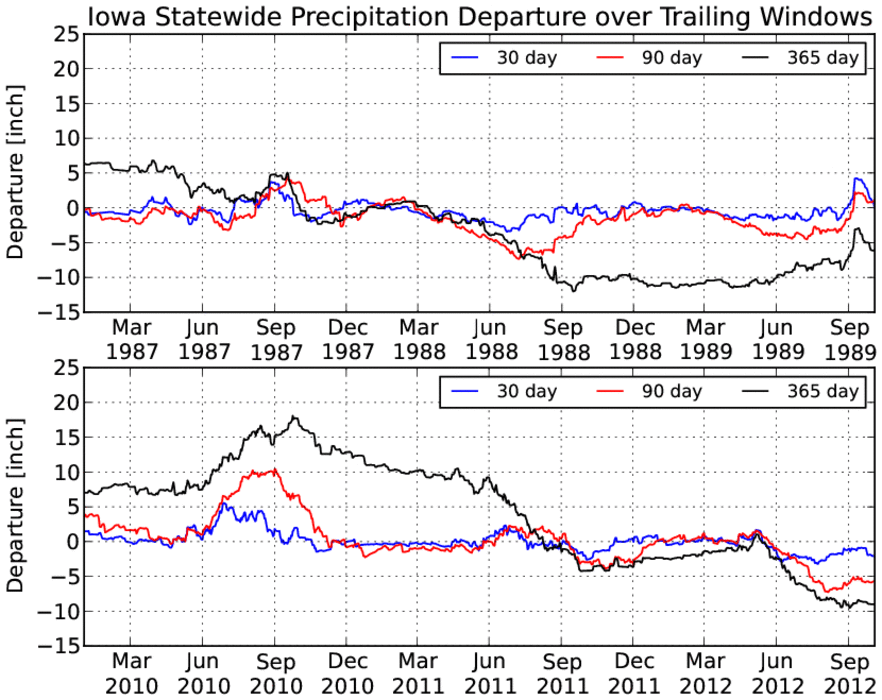
05 Oct 2012 05:45 AMIowa remains in the firm grasp of a drought, but when did it start? It is hard to define when a drought starts as the term "drought" is ambiguous and it takes some amount of time of dry weather before the term can apply. The featured chart looks at the running departure of statewide precipitation over three different windows of time for a period around 1988 and our current drought period of 2012. For this year, this analysis would clearly indicate that significant deficits started showing up in May. Although, a closer look shows somewhat drier conditions existing since September of 2011. Let us compare 2012 with 1988 shown in the top chart. Significant deficits started appearing in March of 1988. If the 2012 drought started in May and 1988 in March, this may provide some insight into why agricultural crops were not a complete failure in the state this year. The reason being there was some soil moisture available to start off the growing season and some precipitation came in late August/September to help out. Notice how the 365 day departure degraded in Aug/Sep for 1988 and flattened out for 2012.
Voting:
Good: 43
Bad: 27
Tags: drought 2012 1988
Getting better and worse
16 Dec 2011 05:57 AMAfter all of the heavy rainfall events of these past four years, it is hard to imagine having drought conditions in Iowa. The featured chart presents a time series of the areal coverage of various drought categories in the state from the National Drought Monitor. The chart shows conditions recently getting both better and worse (two arrows) with the total area under drought shrinking while the area in severe drought condition expanding. This implies that recent precipitation events have missed the hardest hit areas. These areas are in northwest and northcentral Iowa. The near term forecast does not have much hope for large precipitation events.
Voting:
Good: 20
Bad: 3
Tags: drought 2011
Drought History
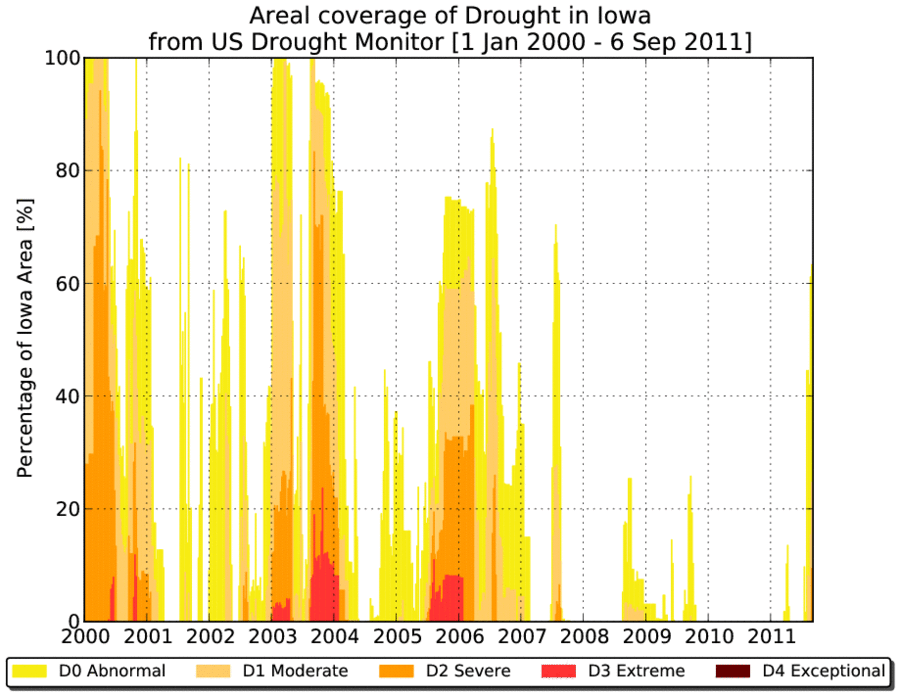
09 Sep 2011 05:54 AMThe current analysis of drought severity in the state has just over half of Iowa under abnormal or worse drought condition. The featured graph shows the history of drought category coverage over Iowa since the year 2000. The past 5 years have been relatively drought free with 2008 and 2010 being very wet years. The forecast does not have much in the way of rain chances for the next week as our dry weather continues.
Voting:
Good: 14
Bad: 4
Tags: drought
Drought?
04 Sep 2008 06:29 AMThe US Drought Monitor has an area of abnormally dry and moderate drought analyzed in Western Iowa. This area has mostly missed the rainfall events in the past few months and is starting to show some agricultural impacts. The remants of Hurricane Gustav are providing rainfall in Eastern Iowa this morning and will slowly push off to the east.
Voting:
Good: 25
Bad: 4
Tags: drought
Only getting worse this winter
24 Feb 2006 07:07 AMThe featured plot highlights the change in the National Drought Monitor classification for the past 5 months. You can see that for the most part, last fall and winter has not been wet enough to recover from accumulated dryness in the state. The catch 22 is that a wet spring could erase some of these rainfall deficits, but would also delay spring planting due to wet fields. We will just have to be thankful for whatever rainfall we get this spring.
Voting:
Good: 27
Bad: 16
Tags: drought
Continues to be dry
27 Jan 2006 07:26 AMThe most recent release of the US Drought Monitor (shown on map) continues to indicate that much of Iowa is experiencing abnormally dry conditions with the driest areas in Southern and Southeastern Iowa. It would be really nice to have a handful of steady and soaking rains this spring before planting season arrives to replemish the soil, but who knows what mother nature has in store for us this spring.
Voting:
Good: 19
Bad: 17
Tags: drought
Dryness continues
20 Oct 2005 07:48 AMThis weeks's drought monitor update continues to depict dry conditions over the entire state save Northcentral and Northwest Iowa. This time of year dryness is a good thing, since most farmers are looking to harvest the corns and need dry fields. The catch is that fall season rainfall can help to recharge moisture depleted soil preparing for the next growing season.
Voting:
Good: 15
Bad: 8
Tags: drought

