Past IEM Features tagged: 2011
2011 by month
04 Jan 2012 01:14 PMContinuing to look back on 2011, we look today at the monthly temperature and precipitation percentiles. The right most bars display the percentile value for the entire year. For comparison, the Ames value is compared with the statewide areal average. The highlights of the year include a warm July and December along with a cold and dry September.
Voting:
Good: 17
Bad: 3
Tags: 2011
2011: Drier than past years
02 Jan 2012 11:07 AMContinuing along in the series of features reviewing the past year, we consider the precipitation departure from average for the year. Most of the state saw below average precipitation, which goes against a recent trend of having very wet years. Most of northwest Iowa is now analyzed in a severe drought condition with some concerns of limited soil moisture recharge before next spring.
Voting:
Good: 25
Bad: 0
Tags: 2011
2011: Plenty of Severe Weather
01 Jan 2012 02:14 PMWith the new calendar year, it is probably a good time to reflect back on 2011. The previous year will be remembered as an infamous year for deadly tornadoes in the US. The featured chart presents the yearly total of NWS issued severe thunderstorm and tornado warnings dating back to 1986 along with the total area covered by these warnings. The area value is expressed in normalized units of the size of the continental United States. For example, enough warnings were issued this past year to cover the CONUS seven times over. The total number of warnings came in slightly behind 2008. The large drop in areal coverage of warnings is due to the change to storm based warnings in 2008, which warns for only partial areas of counties.
Voting:
Good: 9
Bad: 2
Tags: 2011 nws warnings
Getting better and worse
16 Dec 2011 05:57 AMAfter all of the heavy rainfall events of these past four years, it is hard to imagine having drought conditions in Iowa. The featured chart presents a time series of the areal coverage of various drought categories in the state from the National Drought Monitor. The chart shows conditions recently getting both better and worse (two arrows) with the total area under drought shrinking while the area in severe drought condition expanding. This implies that recent precipitation events have missed the hardest hit areas. These areas are in northwest and northcentral Iowa. The near term forecast does not have much hope for large precipitation events.
Voting:
Good: 20
Bad: 3
Tags: drought 2011
Heavy rainfall for December
15 Dec 2011 05:56 AMThe featured map presents precipitation estimates for the past two days from NOAA. A portion of southeastern Iowa is shown in the 1.5 to 3 inch range, which is quite large for December! Unfortunately, the areas that need the rain the most over northwestern Iowa largely missed out again. Temperatures on Wednesday were abnormally warm as well with record maximum low temperatures set in some locations. Normal temperatures return today along with not much hope for a white Christmas.
Voting:
Good: 20
Bad: 2
Tags: 2011
Can't catch 1966
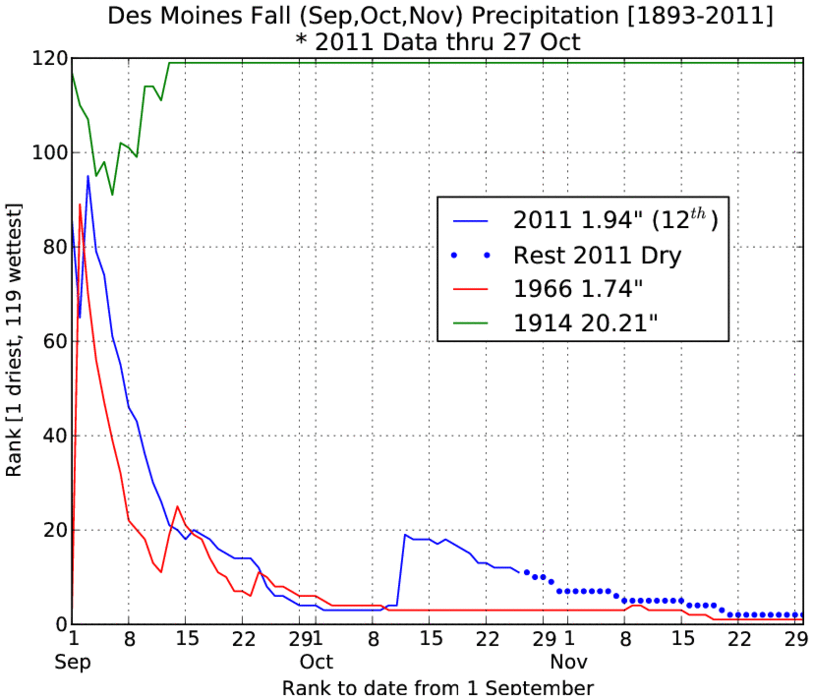
28 Oct 2011 05:55 AMSo far, Des Moines has had its 12th driest meteorological fall on record. The featured chart presents the precipitation rank to date since the first of September for this year, 1914 (the wettest year) and 1966 (the driest year). If we got no precipitation for the rest of the season, our fall total would still be a bit higher than 1966 and coming in second lowest. The forecast has some chances of rain in the forecast next week.
Voting:
Good: 32
Bad: 7
Tags: 2011 fall
Working on four months
25 Oct 2011 05:57 AMThe featured chart presents the monthly precipitation departures from average for Des Moines since January 2005. We are currently working on a streak of four consecutive months below average, which would be the longest streak since the end of 2005. This October is not done yet, but the forecast has no hint that we will make up the difference before November rolls around.
Voting:
Good: 11
Bad: 2
Tags: 2011
Another October streak
14 Oct 2011 05:56 AMOur past 12 days have seen daily high temperatures above climatology making for the longest streak this year. The featured chart presents the daily streaks above or below (negative numbers) for Ames since the beginning of last year. Last year also saw a long streak in October with highs above average. Our streak this year will end soon with reality setting back in. The bottom plot shows the streaks for low temperature and our warm nights in July certainly stick out.
Voting:
Good: 25
Bad: 10
Tags: 2010 2011
Dry last half of summer
26 Sep 2011 05:55 AMThe last half of summer was a dry one and according to IEM estimates of statewide averaged precipitation, the driest since 1984 for the period from 1 July to 24 September. Some rain is in the forecast today before another stretch of dry weather begins lasting into next week.
Voting:
Good: 20
Bad: 5
Tags: 2011 summer
Growing Season ends for some
15 Sep 2011 07:16 AMVery chilly air for this time of year settled into Iowa over night and morning low temperatures were below freezing for most of those in the northern half of the state. Our bout with cold air will be brief as chances of rain are in the forecast along with lows well above freezing.
Voting:
Good: 10
Bad: 7
Tags: freeze 2011
The warmest since...
02 Sep 2011 05:55 AMTemperatures soared well into the 90s on Thursday making for the warmest first of September for Des Moines since the 1980s. The featured chart presents the year one needs to go back to for a high temperature that was as warm as the one reported this year. The cool periods stand out as most of the bars only go back to 2010. Speaking of cooler air, it is working into the state this morning and highs early next week will only be around 70!
Voting:
Good: 22
Bad: 14
Tags: 2011
Prolonged Flood Event
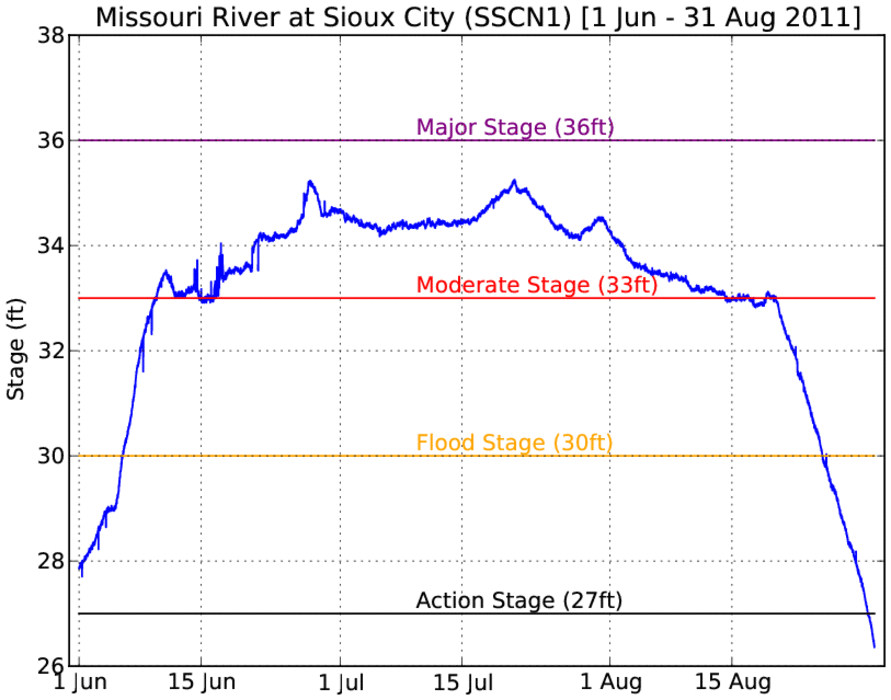
01 Sep 2011 05:52 AMOne of the big stories this year has been the flooding along the Missouri River. The featured chart presents the river stage observation from one of the automated sites near Sioux City. The river was in moderate flood stage for over 2 months! Among other things, this did a tremendous amount of damage to some the highways and interstates in the area which will require complete reconstruction.
Voting:
Good: 20
Bad: 3
Tags: 2011 flood
Warm Days this Summer
31 Aug 2011 05:55 AMThe featured map presents an IEM computed analysis of the percentage of days this summer (since 1 June) that the daily high temperature was above average for that day. Portions of Kansas are shown above 90%! Most of Iowa is depicted around 50-60% as we have had stretches of hot and cool weather. Our actual weather for today will hot and sticky again with highs well into the 90s on Thursday.
Voting:
Good: 16
Bad: 5
Tags: 2011
Early evening heat burst
24 Aug 2011 05:33 AMRapidly decaying storms last evening over southwestern Iowa produced what appears to be a heat burst event. The featured chart is a time series from the Atlantic AWOS showing a temperature rise above 100 degrees and a dew point drop to 7 degrees, which is a classic heat burst type signature. There is some doubt if the 7 degree dew point is legitimate as other sites in the area only dropped to as much as the mid 40s. Regardless, these events typically also bring damaging winds and a few trees were reported down. Heat bursts are not fully understood by scientists yet, but the common explanation is a decaying thunderstorm encounters a layer of dry air below the storm. Virga then falls into this layer, which quickly cools it by evaporation and the air mass rapidly sinks to the ground and warms along the way.
Voting:
Good: 19
Bad: 3
Tags: heatburst 2011
Drought and Flooding
23 Aug 2011 05:58 AMThe featured map presents an estimate of rainfall over the past two months and the current national drought monitor analysis (lines). Southwest Iowa has seen its share of heavy rainfall in the past few weeks and they are currently dealing with flooding. On the other end of the state, southeastern Iowa has been rather dry and the far corner is shown in "D1" (moderate drought) status. Heavy rainfall is falling this morning over north-central Iowa with the heaviest totals over a few inches.
Voting:
Good: 20
Bad: 5
Tags: 2011
Long stretch of muggy
07 Aug 2011 07:21 PMThe recent few days have been refreshing after a stretch of brutally high dew points. Dew point temperatures for Des Moines have yet to decline below 60 since the 3rd of July. This makes for the longest period above 60 for Des Moines since the early 1930s. The featured plot presents the yearly maximum streak of having dew point temperatures above 60 and the time period over which the streak occurred. The plot nicely shows most of these streaks happening over July and August. With August only a week old, there is plenty of time to increase our streak this year.
Voting:
Good: 21
Bad: 5
Tags: dewpoint 2011
Getting both warmth and rain
05 Aug 2011 05:57 AMThis growing season has seen both hot weather and above average rainfall for most places in the state. The featured chart presents Ames stress degree day and precipitation departures from long term averages. 2011 has seen the biggest stress degree day departure since 1988. The top chart clearly shows the years with excess heat having the least amount of rainfall.
Voting:
Good: 17
Bad: 15
Tags: 2011
5 failures to reach 100
04 Aug 2011 05:55 AMOur recent stretch of very warm weather saw some locations in the state hit the century mark. The official weather sensor for Des Moines is a the airport and the best it was able to do was 99 degrees on five different days. The featured chart presents the one minute interval temperature data for these five days. Our most recent chance on 2 August was our best one with temperatures reaching near 100 degrees early in the afternoon, but a front moved through just as the temperature was about to hit 100! The 20 July event saw temperatures hover at 99 for around three hours without hitting 100. Having five days hit 99 without hitting 100 for the year is most on record for Des Moines.
Voting:
Good: 20
Bad: 4
Tags: 100 2011
Second Warmest RAGBRAI
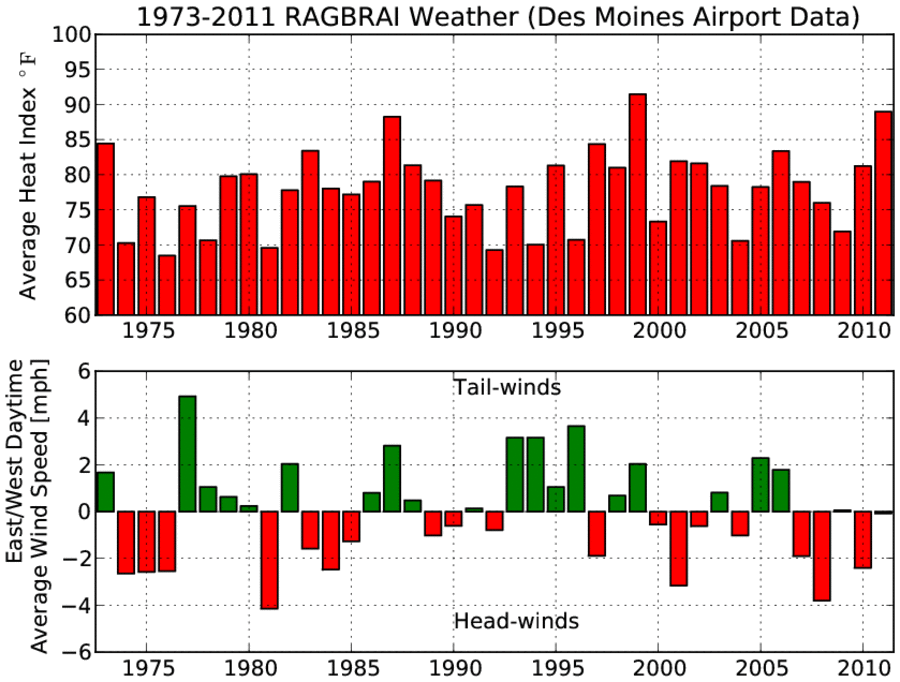
03 Aug 2011 05:57 AMThe Register’s Annual Great Bicycle Ride Across Iowa (RAGBRAI) took place last week and was a quite warm for participants. This 7 day long trek across Iowa starts on the Missouri River and ends on the Mississippi River. Assuming that the weather reported by the Des Moines station is representative of the state, the featured chart presents the average heat index and westerly wind for the six day period each year that RABGRAI occurred on since it started in 1973. This year's average heat index was second to 1999. The bottom chart looks at a simple average of the westerly wind component during daylight hours. A wind from the east (negative values) would mean a head wind for bicyclists generally heading from the west to east. Easterly winds are typically associated with cooler weather, so you can pick your poison or a headwind or hot weather!
Voting:
Good: 19
Bad: 11
Tags: ragbrai 2011
Humid Periods
02 Aug 2011 05:57 AMDew point temperatures once again soared into the upper 70s and lower 80s on Monday. These temperatures were remarkable for the calendar now being in August! The featured chart presents IEM calculated yearly maximum period where the dew point remains above 75 degrees and the total number of hours above 75 degrees. This year is still behind last year by those metrics, but there is still plenty of time to go in August to catch up. While not shown on the chart, many of these humid periods occurred during August.
Voting:
Good: 17
Bad: 3
Tags: dewpoint 2011
Streaks of 90+
19 Jul 2011 05:53 AMYesterday was another very hot day in Iowa with high temperatures nearing 100 degrees. It was the fourth day in a row with a high temperature over 90 for Ames. The featured chart presents the yearly maximum daily streak over 90 degrees for high temperature for Ames. Some years, like 2004, the temperature never got that warm for the entire year! Our current streak has a chance of being the longest we have seen in around 20 years.
Voting:
Good: 10
Bad: 6
Tags: 90 2011
Sunday Night WInd
27 Jun 2011 05:49 AMTwo bow echos raced over Iowa Sunday evening with the second storm system being quite strong. The featured map displays NWS issued local storm reports of strong winds. Gusts over 70 mph were reported at a number of locations. The weather today should be calmer with warmer temperatures expected later in the week.
Voting:
Good: 18
Bad: 6
Tags: 2011
2011 Tornado Warning Counts
15 Jun 2011 05:52 AMThe featured map presents the number of tornado warnings issued by each NWS forecast office so far this year. The largest value is 179 by the Memphis office. This year has seen more than its fair share of tornadoes. The largest numbers of warnings are shifted a bit east of the traditionally known tornado alley. Iowa has seen its share of severe weather recently, but most of it has been hail and wind.
Voting:
Good: 18
Bad: 7
Tags: 2011 warnings
Recently rare warmth
08 Jun 2011 05:54 AMTemperatures again soared well into the 90s on Tuesday with a few sites hitting 100 degrees! It is remarkable to see how long it has been since we have seen temperatures this warm in Iowa. The featured chart displays yearly maximum temperatures for Mason City and yesterday's high of 99 is the warmest since 1995! If one considers that this is only June, one has to go back to 1988 for the previous warmer temperature. It is probably not a good thing when our current weather starts comparing with 1988, which was a drought year in the state.
Voting:
Good: 19
Bad: 6
Tags: 2011
9 days over 100 warnings
27 May 2011 05:54 AMThe featured chart displays the number of tornado warnings issued by the NWS for each day this year. There have been 9 days with over 100 warnings issued per day. In total, there have been 3,147 tornado warnings issued so far this year. This total is only about 300 warnings shy of the entire year's total for 2010.
Voting:
Good: 25
Bad: 16
Tags: 2011 warnings
Busier than last year
18 Apr 2011 05:58 AMThis past weekend saw yet another severe weather outbreak with numerous tornadoes reported over the deep south. The featured map (click for a better view) shows the difference in number of severe and tornado warnings this year versus last year. Only counties shown in dark blue have seen a decrease. The deep south certainly stands out with Alabama having all counties with higher totals than last year. The total count in this plot is 4,779 warnings for 2010 and 14,517 warnings for 2011. The total count for 2011 is the largest on record for the period prior to 18 April.
Voting:
Good: 23
Bad: 4
Tags: 2011 warnings
40 degree warm ups are nice
06 Apr 2011 05:52 AMThe featured chart presents the difference between the afternoon high temperature and the morning low temperature for Ames since the first of the year. On Tuesday, temperatures warmed 40 degrees and made for the second time this year for such a strong warm up. Low temperatures this morning are starting off much warmer than yesterday, so temperatures will not have to warm as much to get us back into the 60s today.
Voting:
Good: 11
Bad: 6
Tags: 2011
50+ dew point in February!
18 Feb 2011 05:55 AMTemperatures soared on Thursday thanks to a very strong push of warm and moist air into the state. The featured analysis presents the maximum reported dew point for the day. A good portion of the state was able to exceed 50 degrees, which is extremely uncommon for February! Des Moines reported a maximum dew point of 53 degrees and there have been only 4 other days in February since 1948 with such a high dew point (10-11 Feb 1999, 27 Feb 1981, and 8 Feb 1966). Temperatures will be much cooler today, but still above average.
Voting:
Good: 22
Bad: 8
Tags: 2011 feb
Hope for last time of seeing this
10 Feb 2011 07:09 AMLow temperatures this morning are very cold over much of the midwestern US. The map presents an IEM analysis of low temperatures so far this morning. One of the more interesting spots on this map is Oklahoma, which may have broken its coldest low temperature on record this morning, but just to its north, temperatures are warmer! The good news is that perhaps this is he last we will see of the bitter cold this winter (one can hope) and much warmer air is expected next week with highs above freezing.
Voting:
Good: 21
Bad: 4
Tags: 2011


