Past IEM Features tagged: usdm
Drought Classification Change
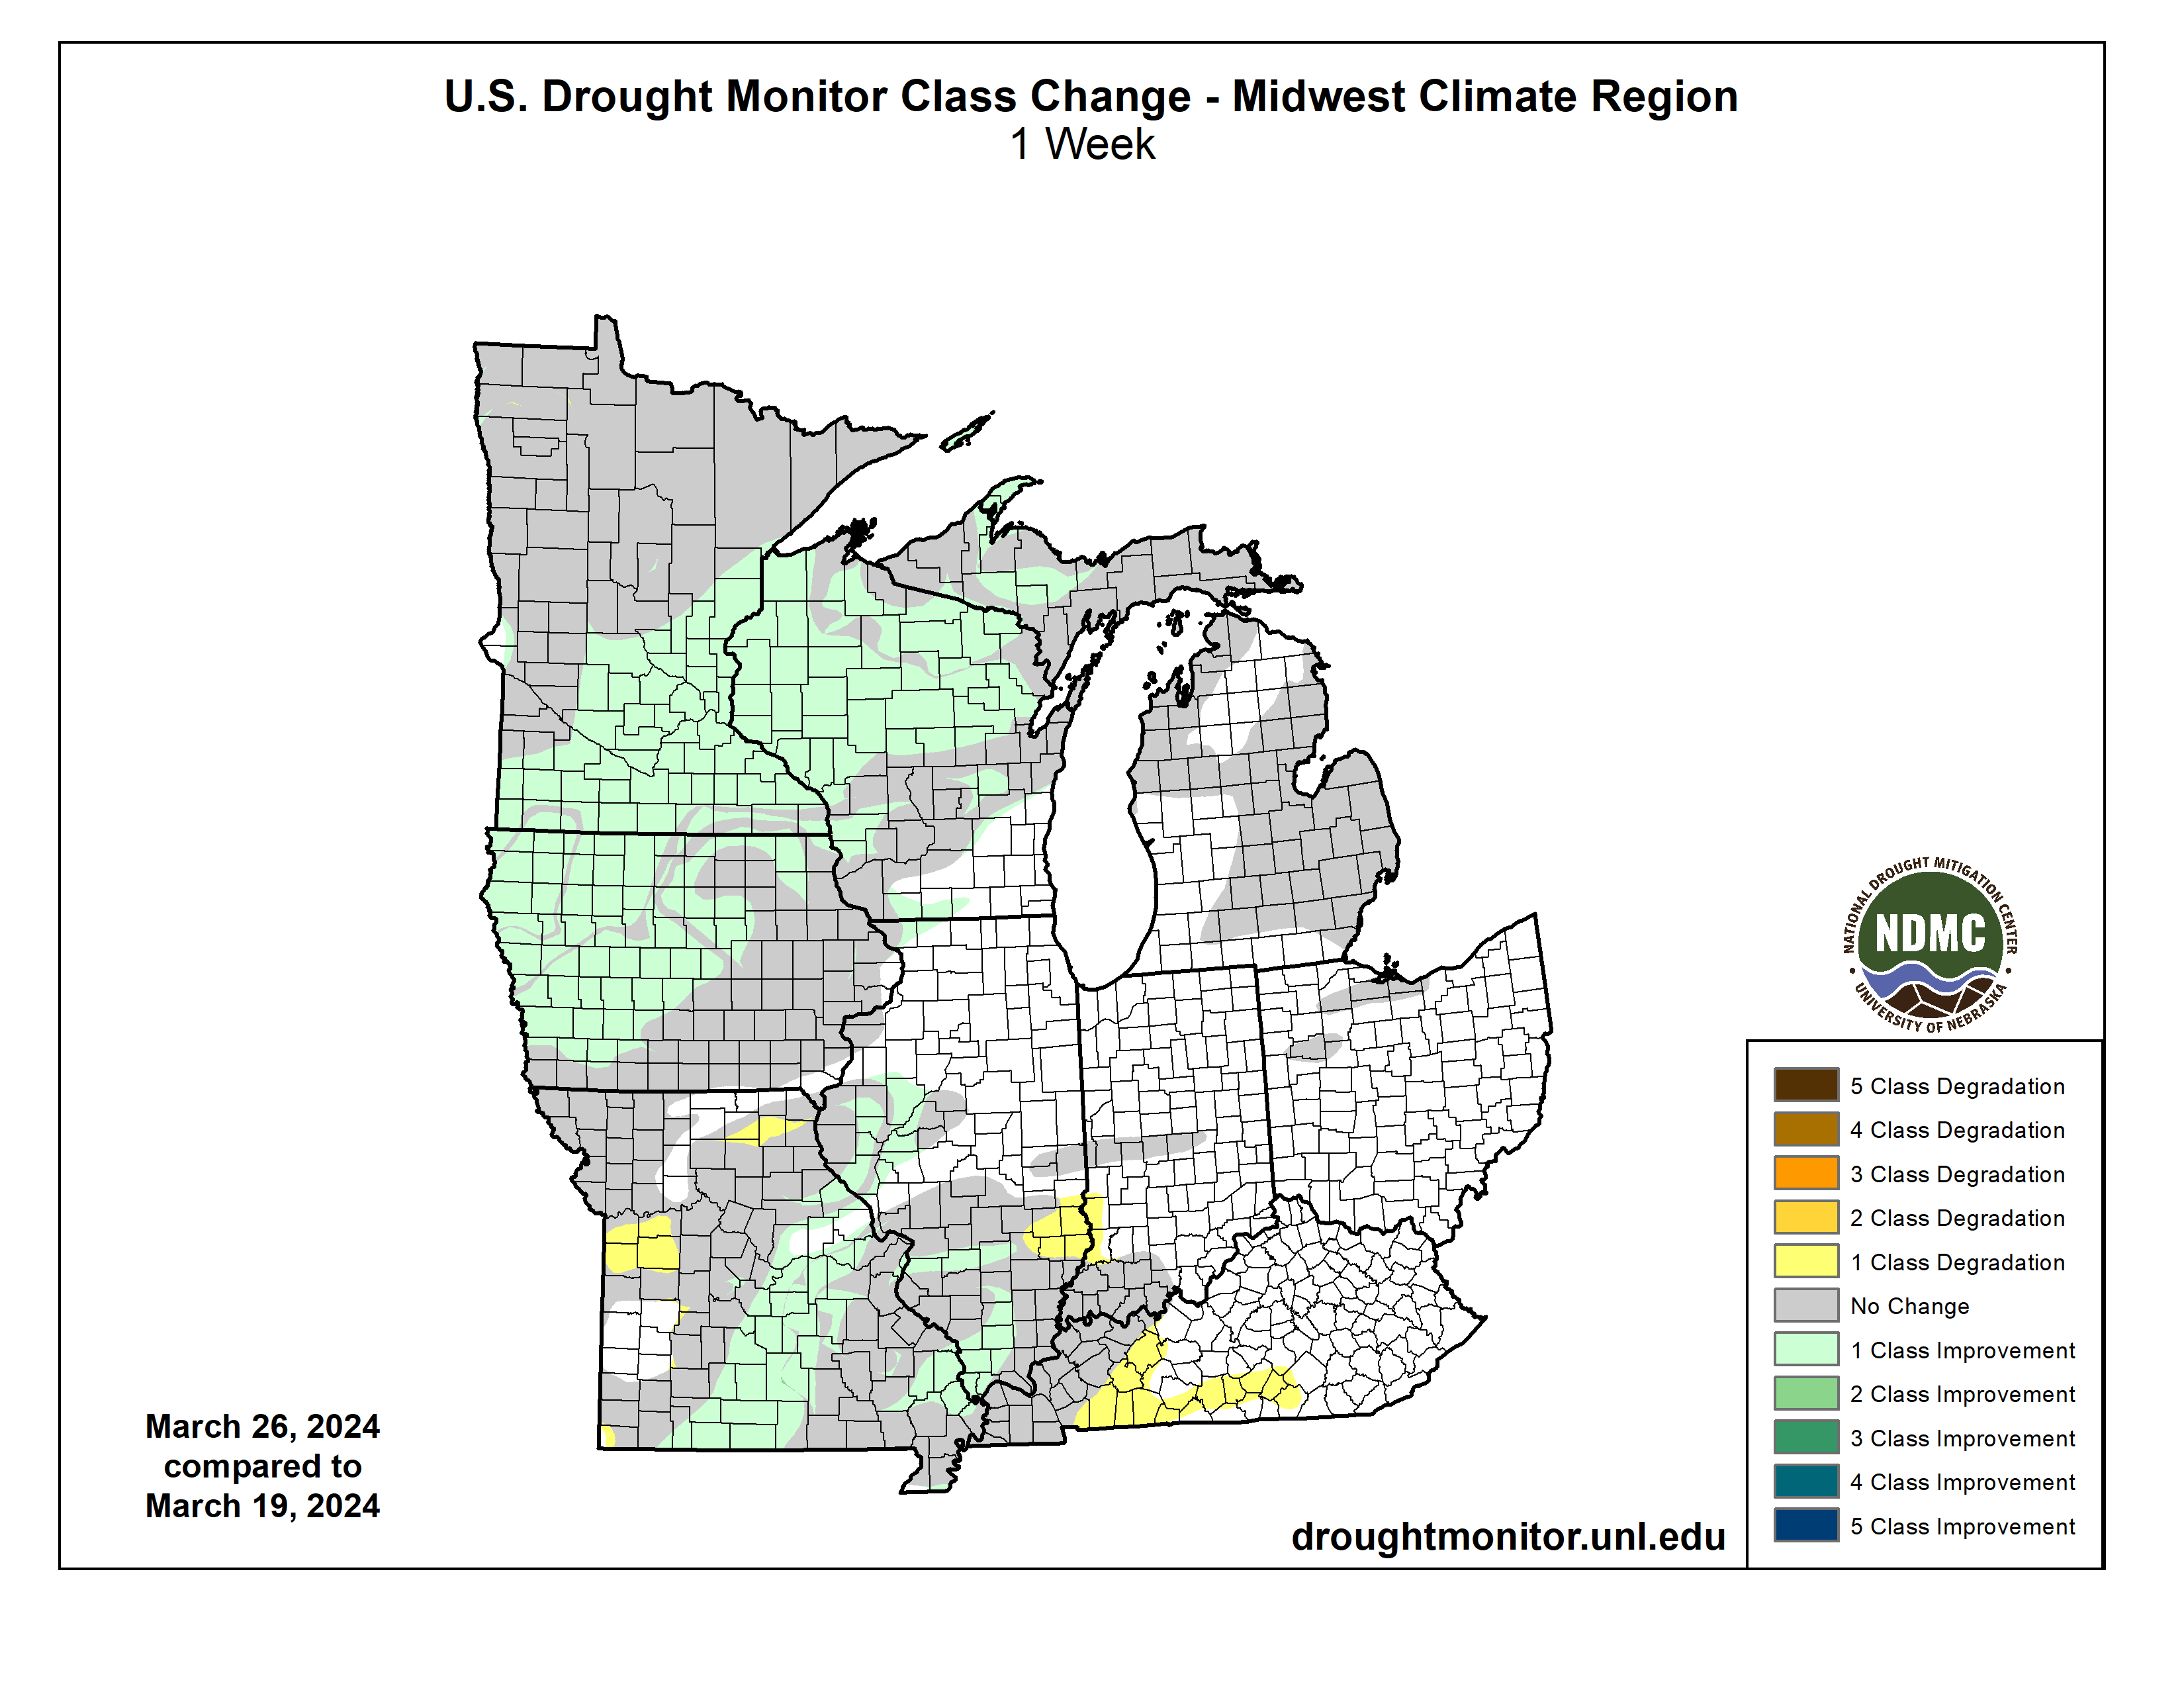
29 Mar 2024 05:30 AMThe featured map is courtesy of the US Drought Monitor website and shows the change in drought classification from last week to this week. Improvements were found over much of the upper Midwest, but we still have a ways to go. A large portion of NE Iowa remains under D3 (extreme drought) classification. There is a large storm forecast for early next week, but it remains to be seen how much of that rain will fall over Iowa as it looks to mostly pass south of the state.
Voting:
Good: 18
Bad: 0
Tags: usdm
Drought Improvements
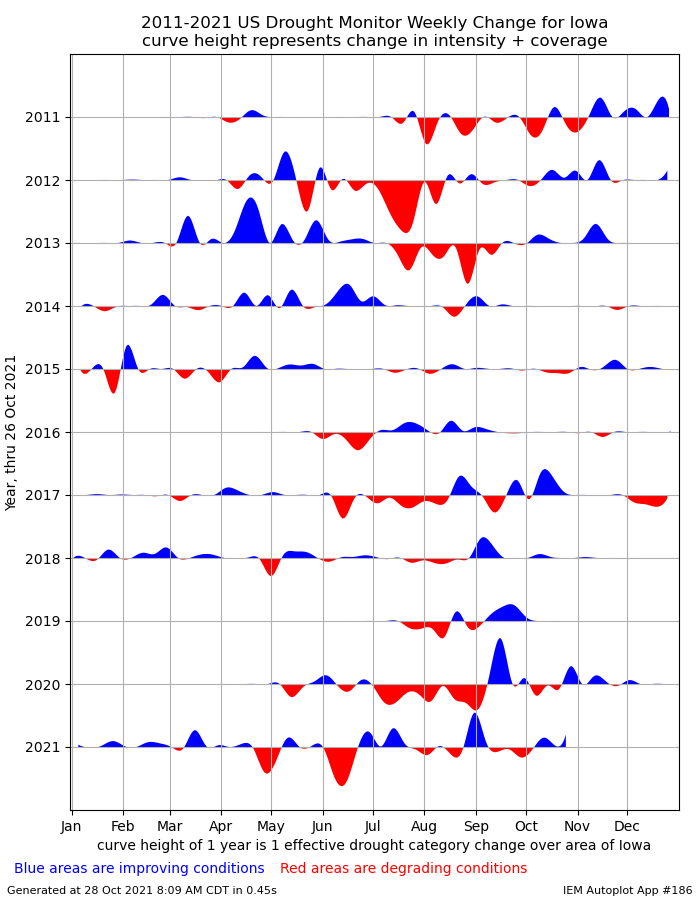
28 Oct 2021 08:14 AMThe weekly update to the US Drought Monitor was just released and shows an improving situation over much of the state. The featured chart presents an IEM calculated metric showing the smoothed weekly improvement (blue) or degradation (red) in the areal coverage over Iowa. The unit measure of one in this chart would represent the areal change over the area of Iowa of one drought category. The big rainfall on Sunday put a dent in the drought and the big rainfalls of yesterday and today will be reflected in the next week's drought monitor update. The weekly update considers rainfall up until about 7 AM of the Tuesday morning of the given week's update.
Voting:
Good: 8
Bad: 0
Tags: usdm
2021 Drought Coverage
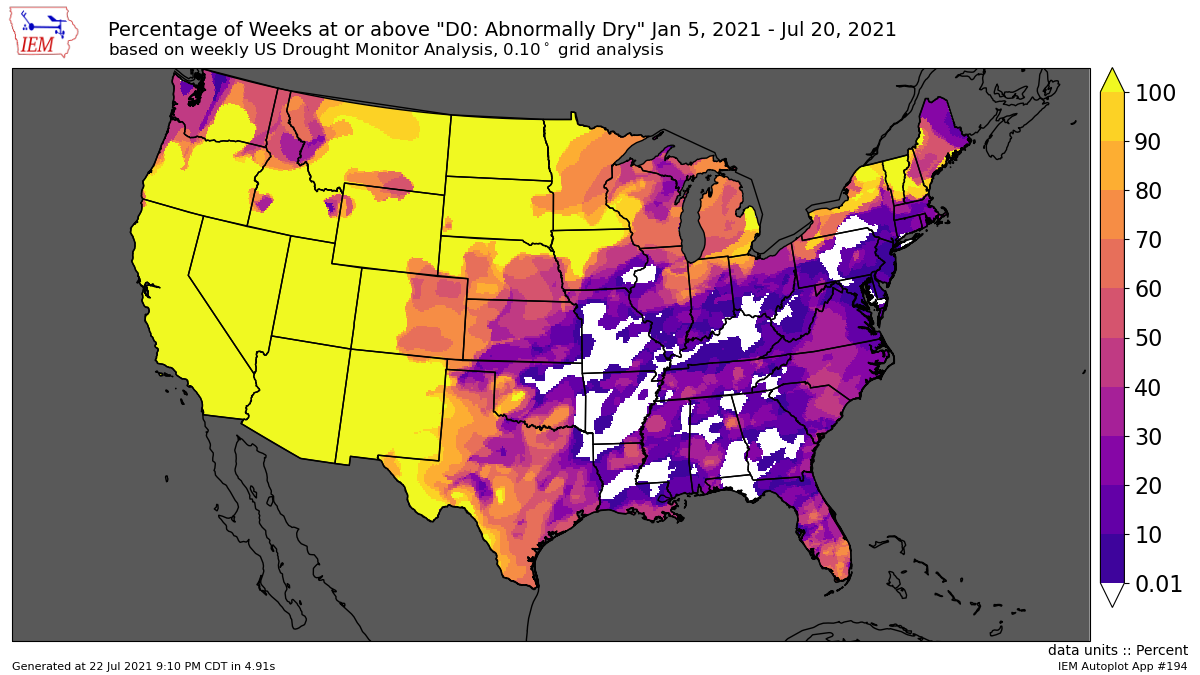
23 Jul 2021 05:42 AMThe weekly update to the US Drought Monitor was released Thursday morning and showed not much improvement to the drought situation over Iowa. The driest areas of the state continued to stay dry with the southeastern portion of the state much wetter and even above average in places. This dichotomy is nicely shown by a heatmap of at least D0 classification drought over the continental US so far this year. Areas in white would be indicated to be drought-free, at least by the drought monitor so far this year. Areas in yellow have been in at least D0 all year long. Iowa is only one of a couple of states shown with both a drought free and 100% drought area within the same sate. Given the lack of rain this week and warmer temperatures, it is certainly likely that next week's drought monitor update will show more degradation over Iowa.
Voting:
Good: 21
Bad: 0
Tags: usdm
Drought Monitor Lapse
21 May 2021 05:52 AMThe weekly update to the US Drought Monitor was released on Thursday and showed little change to the analyzed drought situation for Iowa. The rainfall considered up until Tuesday morning wasn't significant enough to improve the analysis. The featured movie presents a time lapse of the weekly US Drought Monitor over the past two years. It is remarkable to see the lack of analyzed drought over much of the US to start this lapse back in May 2019 compared to now. You can find a longer term line lapse covering the inception of the USDM in 2000 till today.
Voting:
Good: 18
Bad: 0
Tags: usdm
CONUS Drought Coverage
19 Mar 2021 05:29 AMThe weekly update to the US Drought Monitor was made on Thursday and significant improvements were found over areas impacted by the big snow storm earlier this week / past weekend. The featured chart presents a time series of the area covered over the continental US by a given drought classification category since its inception back in 2000. The recent analysis had about half of the CONUS covered by at least D1 drought. The driest area within Iowa remains over northwestern Iowa with D3 still analyzed over a few counties in that region.
Voting:
Good: 8
Bad: 0
Tags: usdm
D3 Returns
07 Aug 2020 04:34 AMThe weekly US Drought Monitor update was released on Thursday and further degradation was shown with the "D3 Extreme" drought category introduced over west central Iowa. This is the first D3 category over Iowa since 2018. The featured chart shows the percentage of the state covered by each of the drought categories since the last D3 in 2018. The good news is that chances of rain continue to be in the forecast, but the most significant rains are forecast to fall just outside of the state.
Voting:
Good: 17
Bad: 0
Tags: usdm
2020 Drought Troubles
31 Jul 2020 04:29 AMThe weekly US Drought Monitor update was released yesterday and showed continued worsening of the drought condition for Iowa. The featured chart presents a smoothed depiction of the weekly change in drought coverage and intensity over the state. A y-axis one unit height represents an effective area of the state changing one drought intensity category. The chart presents these changes since the year 2010 and generally the month of July does not see much improvement in drought. July is when drought stresses can really show up with increased temperatures and high water demand from rapidly growing agricultural crops. The present forecast does not hold much hope for rainfall over the coming week, but temperatures will be cooler.
Voting:
Good: 17
Bad: 0
Tags: usdm
D2 Introduction
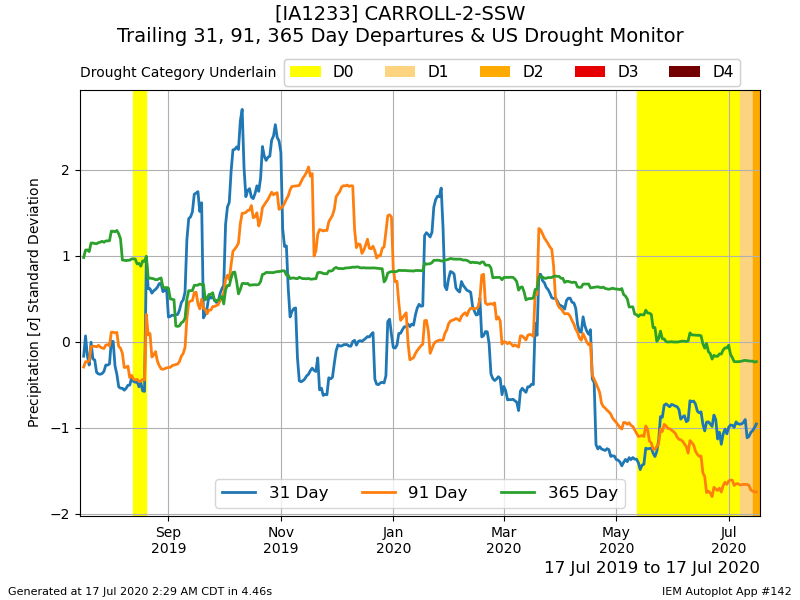
17 Jul 2020 02:40 AMThe big rainfalls of the past week have mostly missed the driest areas of the state. This week's US Drought Monitor update introduces the "D2" (Severe Drought) category to portions of west central Iowa. One such location and one of the driest locations in the state is Carroll. The featured chart presents the combination of trailing day sigma precipitation departures and the analyzed drought category at the time. The chart has a number of interesting stories to tell with the wetness at the end of 2019 now a distant memory as the long term (365 day) departure is now negative. The three month departure is where the trouble lies as rain has been difficult to come by this growing season.
Voting:
Good: 16
Bad: 0
Abstain: 1
Tags: usdm
Wet and Dry Areas
03 Jul 2020 08:12 AMThe just released US Drought Monitor continues to paint a dry picture over western Iowa with a considerable portion of that area analyzed in "D0" drought status. The featured map presents the combination of the current drought monitor and the past 30+ days precipitation departure. The Drought Monitor blends a number of short and long term indicators along with reported impacts to produce the analysis, so there is no one-to-one relationship with the map shown. The drought situation continues to be of concern as warmer weather, developing crops with increased water demand, and continued lack of considerable rain in the forecast look to degrade the drought situation further over the coming weeks.
Voting:
Good: 13
Bad: 0
Tags: usdm
Drought Concerns into June
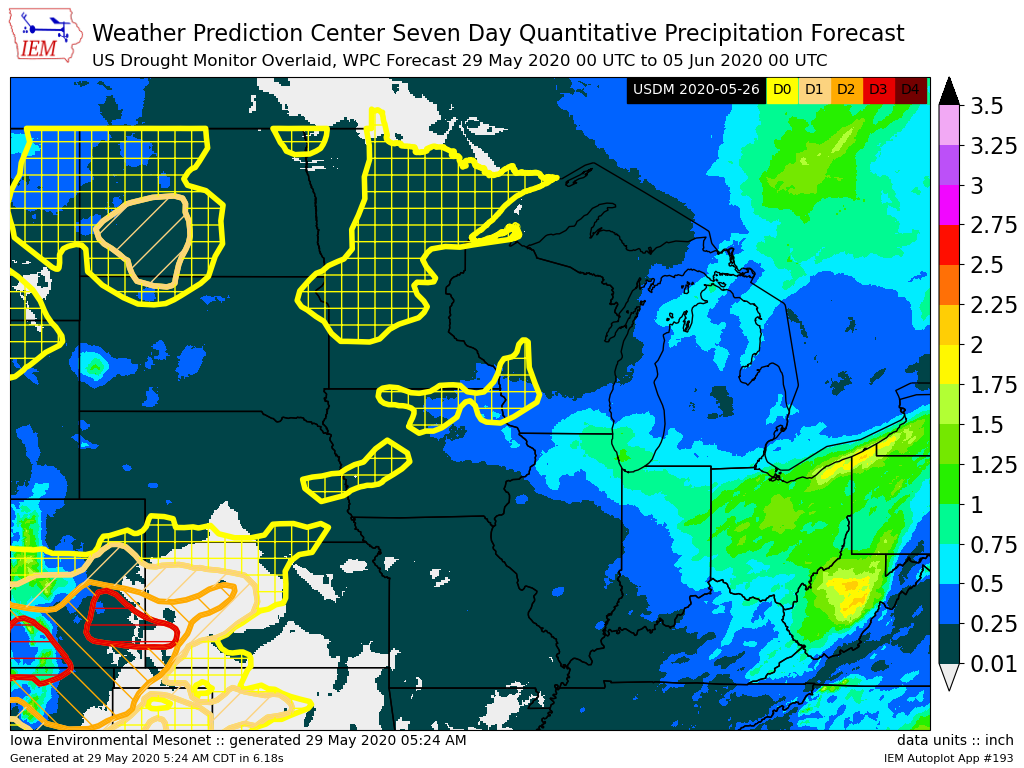
29 May 2020 05:30 AMThe featured map displays the combination of Weather Prediction Center seven day precipitation forecast and the latest US Drought Monitor (from Tuesday morning). The combination shows that not much precipitation is forecast to fall over the driest areas depicted on the map. Some portions of northeastern Iowa will likely see an improvement though in the analyzed drought condition issued next week as the heavy rains of this week in the area came after the weekly publishing deadline. The dryness so far hasn't been too impactful as temperatures have been rather cool. The forecast continues to advertise a return to summer-time heat once the calendar turns to June.
Voting:
Good: 14
Bad: 1
Tags: usdm
Drought Free since October
06 Apr 2020 04:05 AMThe featured map presents an analysis of the percentage of weeks since 1 October 2019 that a given location has been analyzed with at least a "D0" classification of drought. Practically all of the upper Midwest has been drought free for this period. This period has not only been dry, but very wet as well with agricultural fields having plenty of water going into what is typically the wettest time of the year (April to June).
Voting:
Good: 9
Bad: 0
Tags: usdm
Drought Timescales
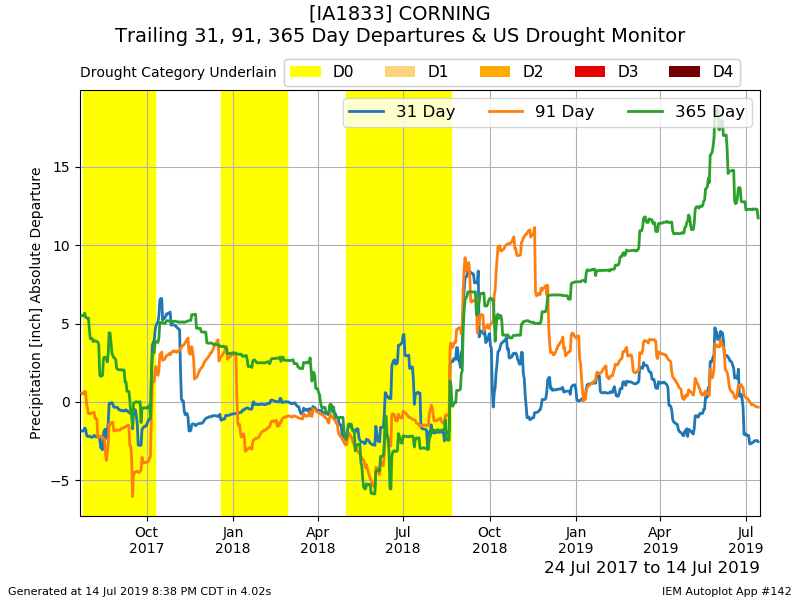
15 Jul 2019 05:34 AMAfter a very wet spring and one of the wettest 365 day periods on record for the state, recent dry and hot weather has concerns of drought back on the radar. The featured chart depicts trailing day precipitation departures and the analyzed US Drought Monitor for Corning (southwestern Iowa). Focusing on the most recent data, one can see a very large difference between near term (31 and 91 day) precipitation departures and that of the past 365 days. Such large differences like these are currently common over much of southern Iowa with reports starting to trickle in of water stressed crops. Given the current forecast, having drought officially analyzed in the state again does not appear to be far off.
Voting:
Good: 14
Bad: 0
Tags: drought usdm
Drought Monitor Weekly Changes
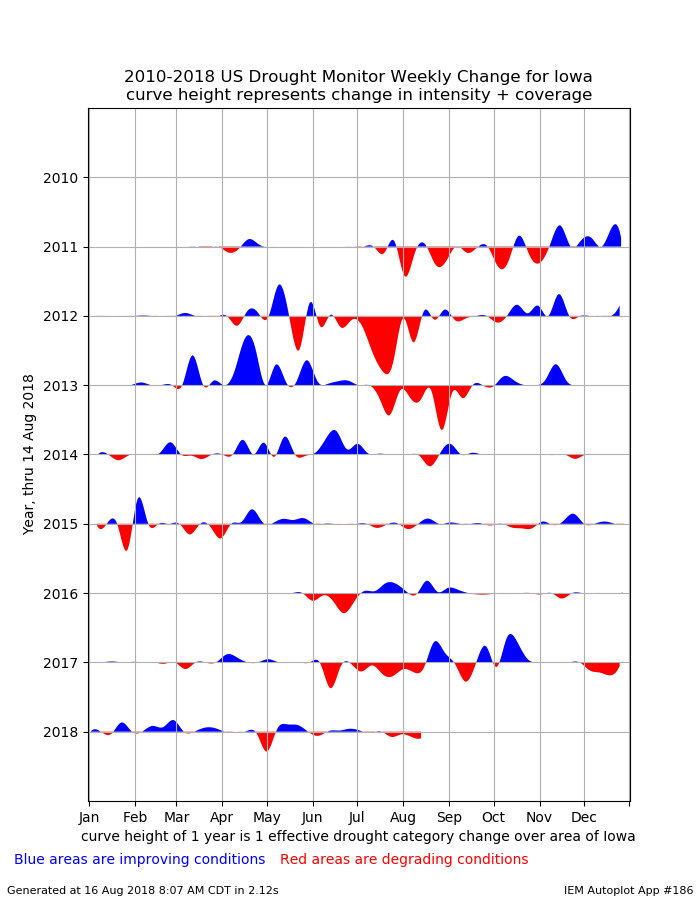
16 Aug 2018 05:36 AMThis week's US Drought Monitor will be released later this Thursday morning and should show continued degradation of the drought situation over Iowa. The featured chart attempts to illustrate the magnitude of the week to week changes in the Drought Monitor depiction over the state. The weekly data is smoothed to give a more visually appeasing appearance. The magnitude of the weekly changes is expressed in units of net one category change in the depiction over an area of the state. Putting those difficult units aside, the relative size shows the larger and smaller changes in the depiction. Of note in the plot is the year 2010, which was a flood year and had no drought analyzed over Iowa. For this year, the changes have been rather muted as the most intense portion of the drought has been confined over far southern Iowa. The lack of recent rains over most of the state now has analyzed drought creeping further north. The chart also nicely shows when the improvements showed up last year, which was late August into October.
Voting:
Good: 6
Bad: 1
Tags: usdm
Next Seven Days
03 Aug 2018 05:34 AMThe weekly update to the US Drought Monitor was released on Thursday and showed a continued degradation over southern Iowa. For agricultural crops that are still holding on for some needed rain this growing season, time is running out. The featured map depicts the combination of the most recent Drought Monitor and the seven day forecasted precipitation amount from the Weather Prediction Center. The heaviest totals are inconveniently predicted to the north of the driest area over the state. A silver lining here is that the map is not full of zero precipitation predictions, but hotter temperatures are expected which will increase the stress on already stressed crops in the area.
Voting:
Good: 16
Bad: 0
Tags: wpc usdm
Full Year of Drought
08 Jun 2018 05:34 AMThe drought situation in Iowa continues to be of concern as significant rains for May and June have not panned out for all parts of the state. For much of southeastern Iowa, the US Drought Monitor has maintained at least D0 status for nearly the past year. The featured map depicts the percentage of weeks since 13 June 2017 that a given area was under any classification of drought (D0 and higher). The 13 June 2017 date was chosen as it was the first significant coverage of drought last June after the rains of May 2017. So the situation this year is a bit different than last with persistent drought in the area going into the heart of the growing season. You can generate this map for other states and time periods of your choice.
Voting:
Good: 12
Bad: 1
Tags: usdm drought
Drought Improvement or Degradation this Spring?
16 Feb 2018 05:34 AMThe newly released US Drought Monitor this week showed a bit of improvement over Iowa thanks to the numerous recent rounds of snow storms. The featured chart looks at the weekly change in drought coverage over Iowa since 2000. The unit height represents a one category change in the coverage of the Drought Monitor over Iowa. Placing aside the difficulty with those units, the blue sections would indicate improvements and red degradation. What's interesting to note in this chart when we think about what may be happening this spring is that having further degradation during the spring season is rather rare. Only 2015 during the past 15 years experienced significant degradation prior to the first of May. So it will be interesting to see what happens this spring!
Voting:
Good: 10
Bad: 3
Abstain: 2
Tags: drought usdm
Continued Drought
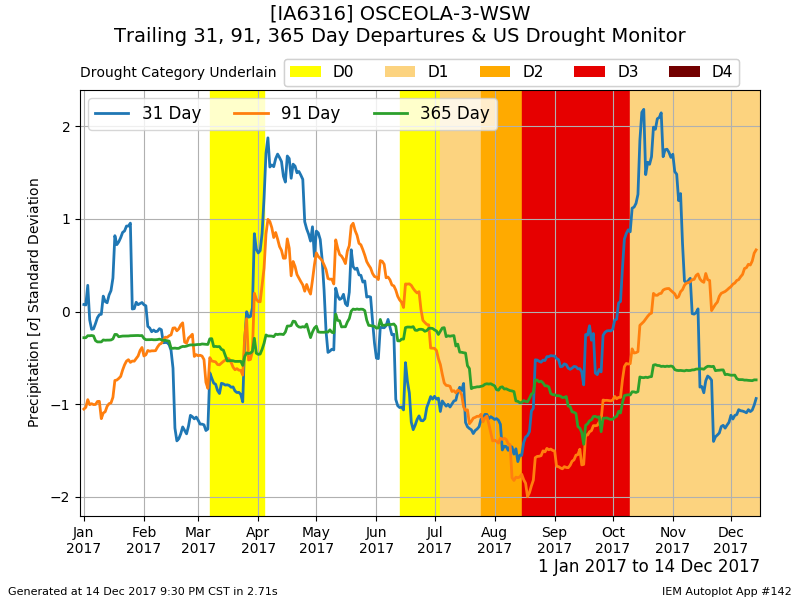
15 Dec 2017 05:35 AMThe weekly US Drought Monitor was released yesterday and depicts a worsening drought situation in the state. While heavy rains frequented the state in October, we have turned very dry again. The featured chart presents the combination of trailing day precipitation departures expressed in terms of standard deviations from long term averages for Osceola (just south of Des Moines). The shaded areas represent the US Drought Monitor conditions analyzed for the location. This area was particularly hard hit this year and while the heavy rains in October did remove the D3 category, the area has remained in D2 since. There is no one magic metric that determines the drought category, but a number of metrics are considered and local reported impacts.
Voting:
Good: 14
Bad: 3
Abstain: 3
Tags: usdm
Limited Help for Drought
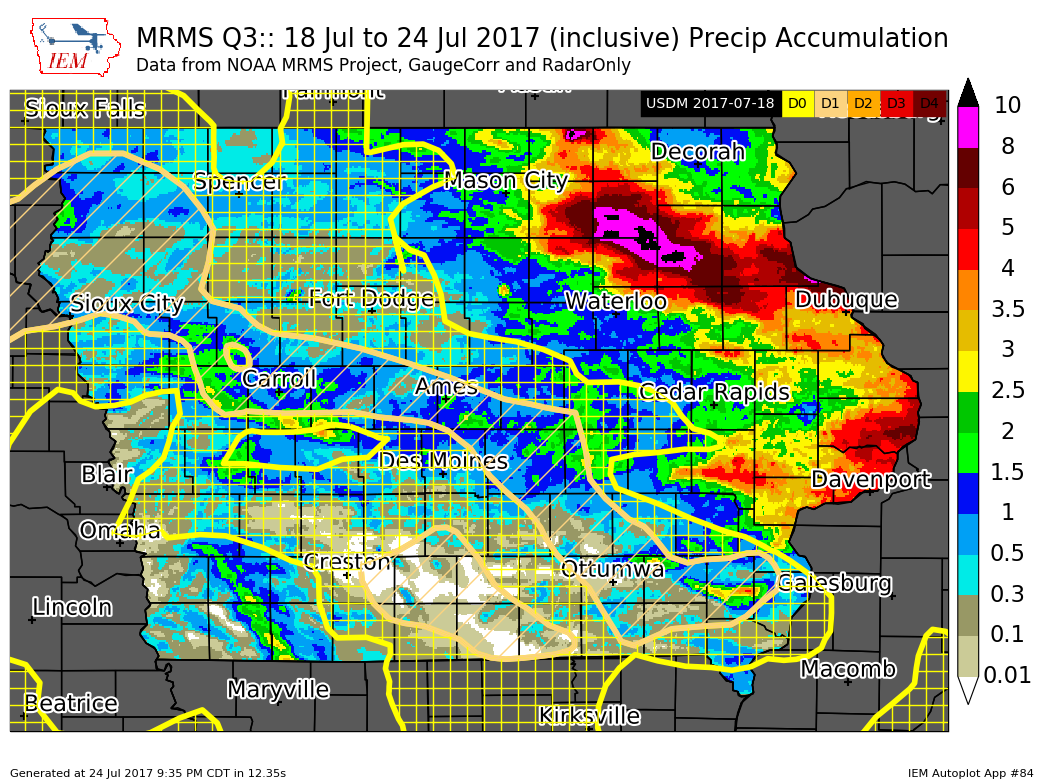
25 Jul 2017 05:32 AMThe publication of the US Drought Monitor update for this week is currently in progress. It considers the precipitation that has fallen up to Tuesday morning of each week and is released on Thursday. The featured map displays the combination of the current drought monitor issued last week and the seven days of precipitation that roughly fell since its issuance. The hatched areas on the map are the drought monitor categories. In general, there was little help for the rain that did fall last week for the driest areas of the state. Some localized dry places did pick up an inch or two, but that amount of water only meets current intensive crop demands. The most significant and flooding rains fell almost completely away from the dry areas.
Voting:
Good: 21
Bad: 0
Tags: usdm
Dryness surrounding us
27 Oct 2006 12:25 AMYou don't have to drive very far from Iowa to find areas with significant precipitation deficits. "D3" classified drought areas are currently depicted in Central Missoura, Western Nebraska, and Northern Minnesota. Only extreme portions of SE Iowa are depicted with any dry conditions. Rainfall this weekend should help alleviate the dryness in Missoura and mostly miss Iowa as the system tracks to our south.
Voting:
Good: 25
Bad: 9
Tags: usdm
