Past Features
This page lists out the IEM Daily Features for a month at a time. Features have been posted on most days since February 2002. List all feature titles.
Mon Jun 03, 2024
Wet Spring 2024
03 Jun 2024 05:30 AM
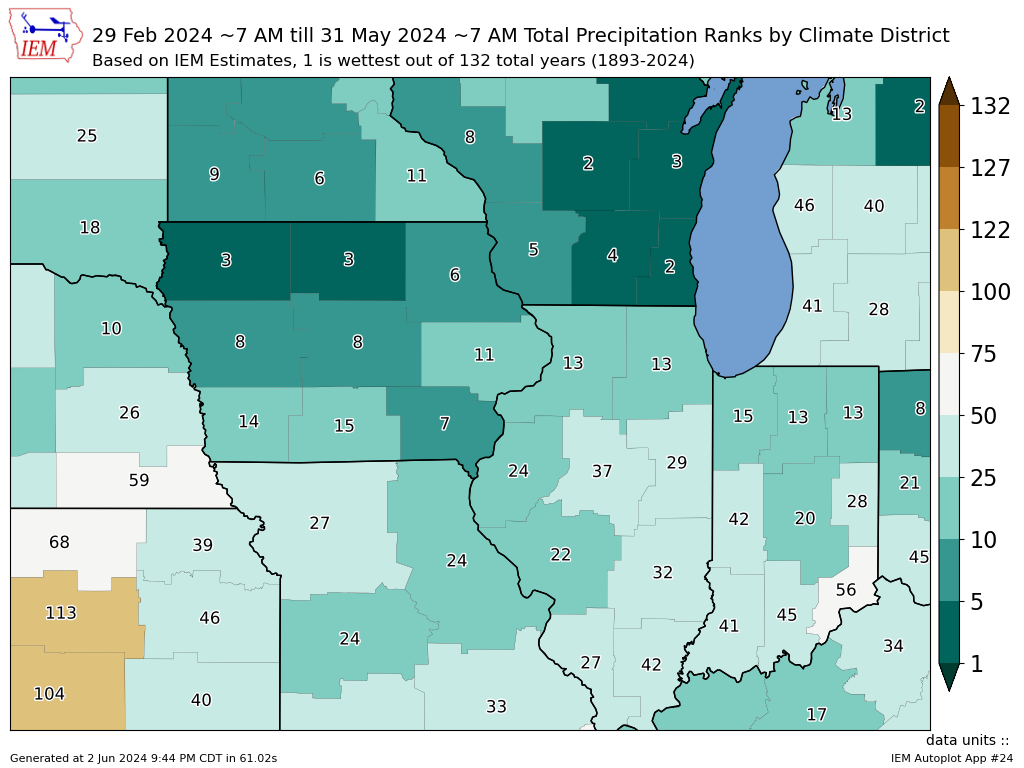
Going into this spring season, the accumulated precipitation departures over the past year were of great concern. The winter season had been wetter than average, but amounts during the coldest part of the year are generally never going to be enough to erase long term drought. The featured map presents IEM computed and unofficial precipitation rankings for the March through May spring season by climate district. A value of 1 would represent the wettest on record since 1893. Almost all of the corn belt region is shown above average for precipitation with many of the districts in Iowa are in the top 10. All of the wet weather has put a delay on finishing the planting season and early crop development, but it is difficult to argue against all of this needed moisture to help replenish soil moisture reserves and put in some buffer for any potential upcoming dryness that typically visits the state each growing season.
Voting: Good - 14 Bad - 1
Generate This Chart on Website
03 Jun 2024 05:30 AM
Going into this spring season, the accumulated precipitation departures over the past year were of great concern. The winter season had been wetter than average, but amounts during the coldest part of the year are generally never going to be enough to erase long term drought. The featured map presents IEM computed and unofficial precipitation rankings for the March through May spring season by climate district. A value of 1 would represent the wettest on record since 1893. Almost all of the corn belt region is shown above average for precipitation with many of the districts in Iowa are in the top 10. All of the wet weather has put a delay on finishing the planting season and early crop development, but it is difficult to argue against all of this needed moisture to help replenish soil moisture reserves and put in some buffer for any potential upcoming dryness that typically visits the state each growing season.
Voting: Good - 14 Bad - 1
Generate This Chart on Website
Tue Jun 04, 2024
Three Days of 80+
04 Jun 2024 05:30 AM
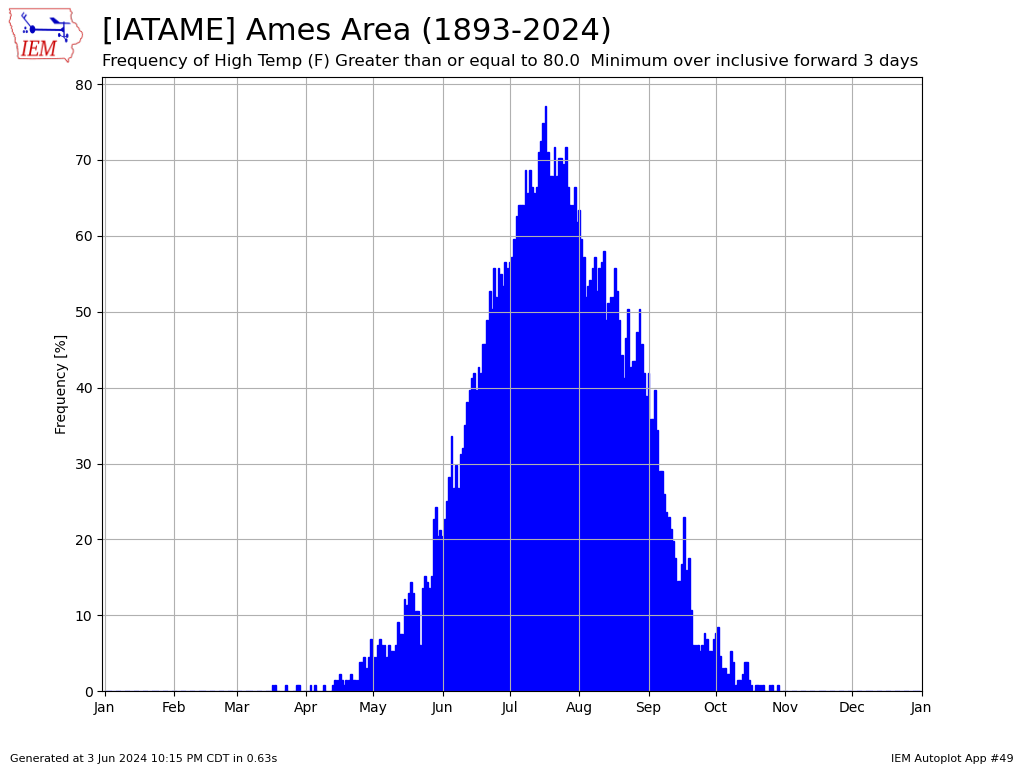
It is now June and summertime, so the increase in heat and humidity on Monday certainly reminded Iowans of the season we are currently in. Tuesday is expected to be another warm day with temperatures in the 80s and strong thunderstorms firing during the afternoon hours. Such a high temperature would make the third day in a row at 80°F plus for Ames. The featured chart presents the day of the year frequency for that day and the following two to have a high temperature of at least 80 degrees. June is certainly the ramp up month for this frequency with values increasing from 20% to 60% by the end of the month.
Voting: Good - 15 Bad - 0
Generate This Chart on Website
04 Jun 2024 05:30 AM
It is now June and summertime, so the increase in heat and humidity on Monday certainly reminded Iowans of the season we are currently in. Tuesday is expected to be another warm day with temperatures in the 80s and strong thunderstorms firing during the afternoon hours. Such a high temperature would make the third day in a row at 80°F plus for Ames. The featured chart presents the day of the year frequency for that day and the following two to have a high temperature of at least 80 degrees. June is certainly the ramp up month for this frequency with values increasing from 20% to 60% by the end of the month.
Voting: Good - 15 Bad - 0
Generate This Chart on Website
Wed Jun 05, 2024
Record Start for DVN
05 Jun 2024 05:30 AM
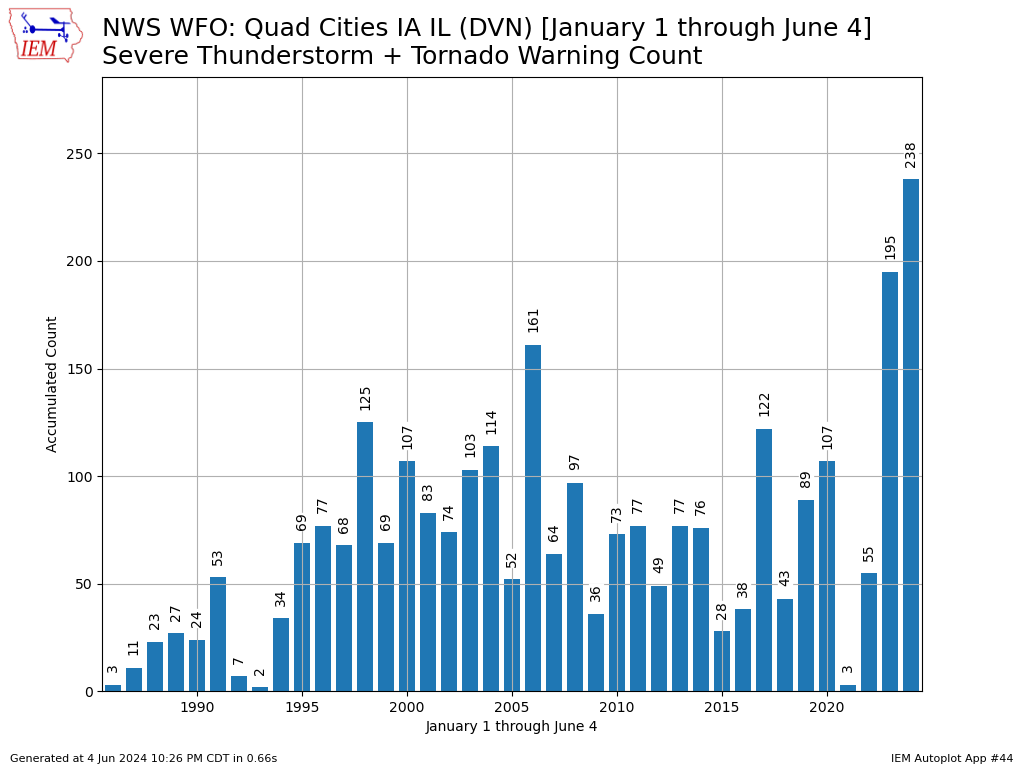
A bit of severe weather rolled through Iowa on Tuesday with the NWS offices covering the state issuing a handful of warnings. It has been a rather active year for severe weather as evidenced by the featured chart. It presents an IEM accounting of office issued severe thunderstorm and tornado warnings since 1986. An import caveat is that this office did not exist in its present form in 1986, but there were many smaller offices around at the time. Some IEM work many years ago attempted to rectify all these warnings into the present day office, but it was not perfect and data quality / archive completeness prior to the early 1990s is always of concern. All those concerns put aside, the total for 2024 is easily the largest on record for the year to date period. It stands in remarkable contrast to the total of three just three years ago in 2021.
Voting: Good - 12 Bad - 0
Generate This Chart on Website
05 Jun 2024 05:30 AM
A bit of severe weather rolled through Iowa on Tuesday with the NWS offices covering the state issuing a handful of warnings. It has been a rather active year for severe weather as evidenced by the featured chart. It presents an IEM accounting of office issued severe thunderstorm and tornado warnings since 1986. An import caveat is that this office did not exist in its present form in 1986, but there were many smaller offices around at the time. Some IEM work many years ago attempted to rectify all these warnings into the present day office, but it was not perfect and data quality / archive completeness prior to the early 1990s is always of concern. All those concerns put aside, the total for 2024 is easily the largest on record for the year to date period. It stands in remarkable contrast to the total of three just three years ago in 2021.
Voting: Good - 12 Bad - 0
Generate This Chart on Website
Thu Jun 06, 2024
Ames Daily Precipitation
06 Jun 2024 05:30 AM
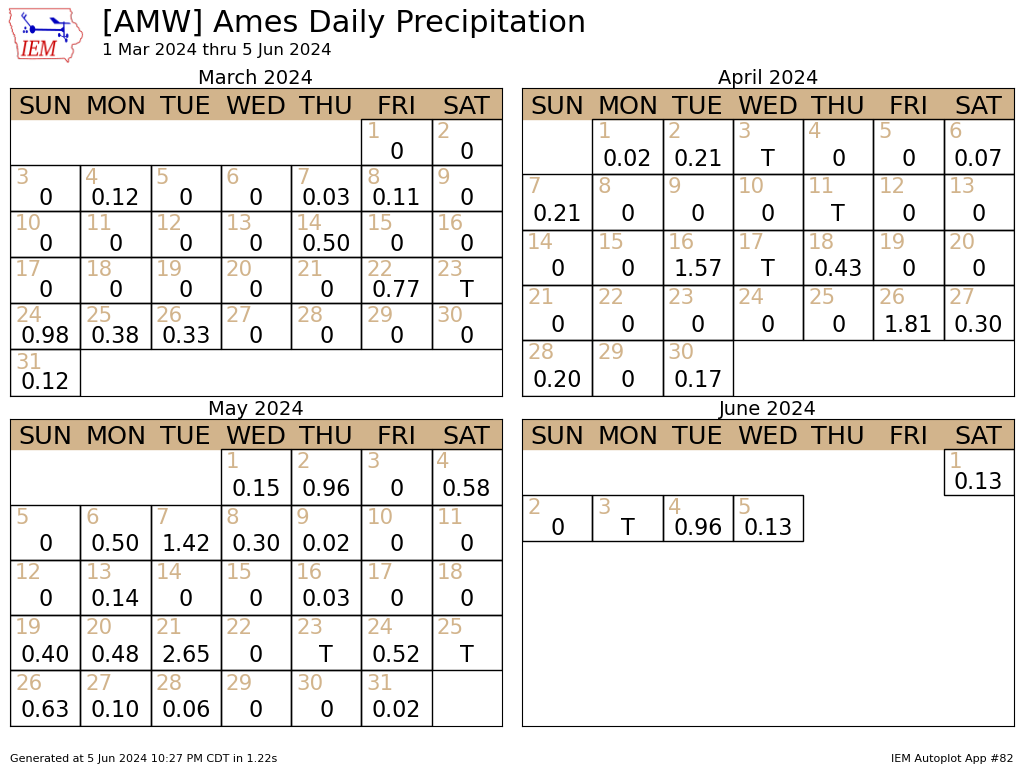
Our current wet and unsettled weather pattern continued on Wednesday with another round of showers and thunderstorms visiting the state. The featured chart presents the daily precipitation reports for the Ames airport since 1 March. Over the past 18 days, only four of them were without even a trace of precipitation. All this rainfall was certainly welcome for a drought stricken state, but we could certainly use some dry weather as well to help finish spring season agricultural field work and other industries like construction. The present Weather Prediction Center Precipitation Forecasts and Climate Prediction Center outlooks have not much for upcoming significant rainfall. Of course, sometimes folks want to be careful what they wish for as this is the climatological peak precipitation season, so any dry weather now can quickly turn into significant departures if multiple weeks of limited rain stack up.
Voting: Good - 14 Bad - 0
Generate This Chart on Website
06 Jun 2024 05:30 AM
Our current wet and unsettled weather pattern continued on Wednesday with another round of showers and thunderstorms visiting the state. The featured chart presents the daily precipitation reports for the Ames airport since 1 March. Over the past 18 days, only four of them were without even a trace of precipitation. All this rainfall was certainly welcome for a drought stricken state, but we could certainly use some dry weather as well to help finish spring season agricultural field work and other industries like construction. The present Weather Prediction Center Precipitation Forecasts and Climate Prediction Center outlooks have not much for upcoming significant rainfall. Of course, sometimes folks want to be careful what they wish for as this is the climatological peak precipitation season, so any dry weather now can quickly turn into significant departures if multiple weeks of limited rain stack up.
Voting: Good - 14 Bad - 0
Generate This Chart on Website
Fri Jun 07, 2024
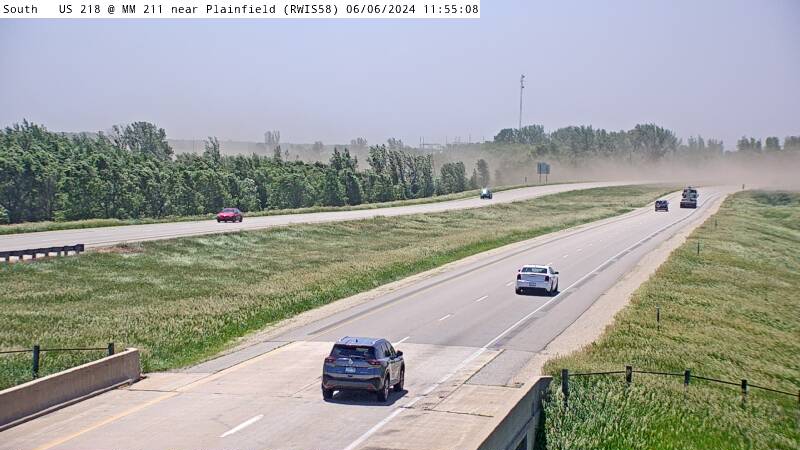
Blowing Dust
07 Jun 2024 05:30 AM
Strong winds, full sunshine quickly drying surfaces, and recently tilled agricultural fields combined to create significant blowing dust over much of northern Iowa on Thursday. The featured webcam shot is from an Iowa DOT RWIS webcam near Plainfield (north of Waterloo) and nicely illustrates the driving dangerous associated with blowing dust. Namely, the rapid change from excellent horizontal visibility to something approaching near zero. Even with all of the recent rains, full June sunshine and low humidity can quickly dry an exposed soil surface and away it blows.
Voting: Good - 15 Bad - 2
Generate This Chart on Website
Mon Jun 10, 2024
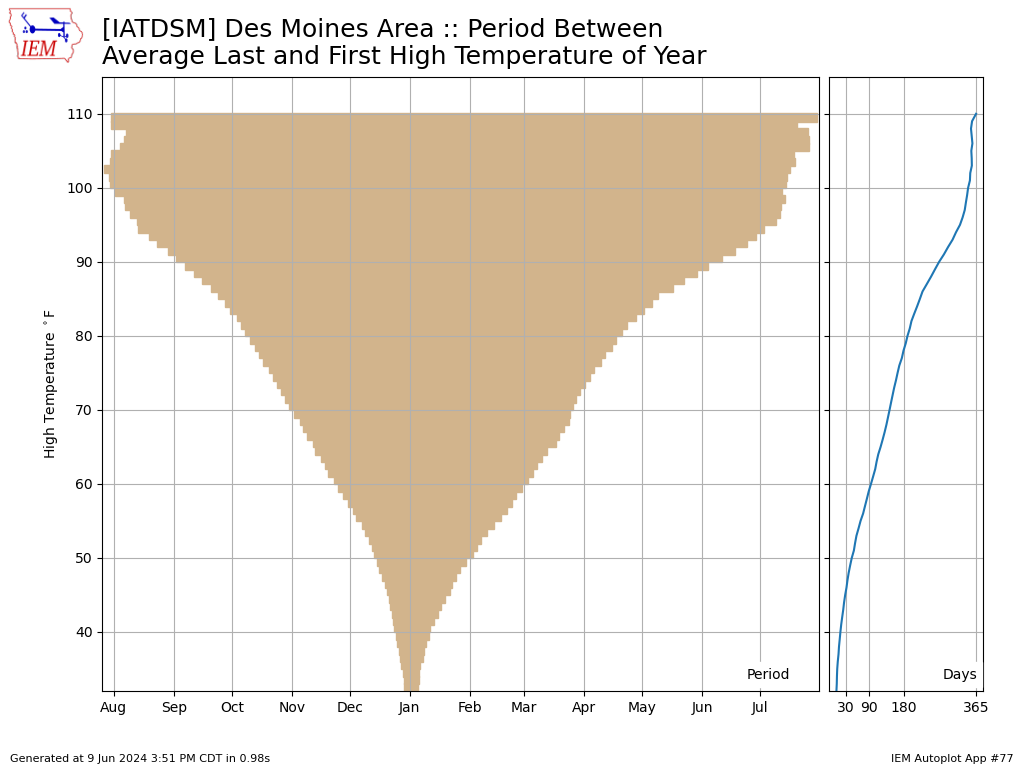
Expected First 90 This Week
10 Jun 2024 05:30 AM
Summer time heat is forecast for later in this week with a number of locations in the state experiencing their first 90+ degree high temperature of the year. The featured chart presents the average period between the year's last and first occurrence of a given high temperature threshold for Des Moines. For the 90 degree threshold, the average period is indicated between the first week of September and about the second week of June, so this year will be right on schedule if the forecast verifies. The increase in heat and humidity will also bring chances of thunderstorms and severe weather. But for Monday, a very pleasant day of weather is expected.
Voting: Good - 7 Bad - 2
Generate This Chart on Website
Tue Jun 11, 2024
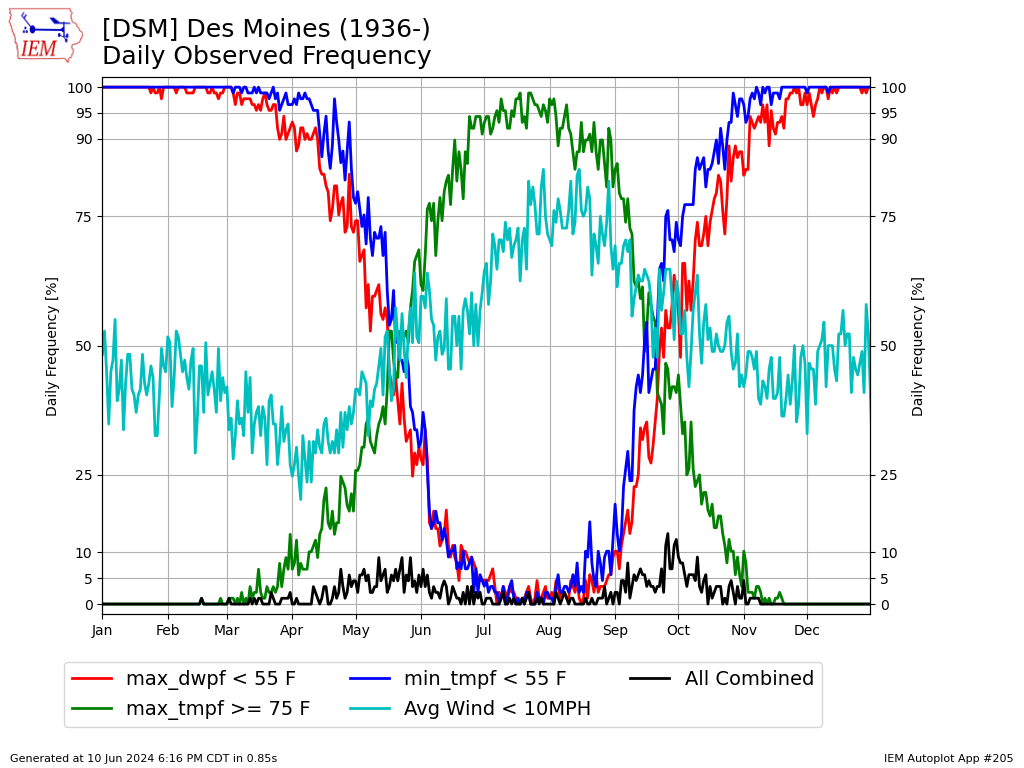
Chamber of Commerce Day
11 Jun 2024 05:30 AM
There is no formal definition of the weather that constitutes a Chamber of Commerce Day as ten people will likely have ten opinions on what it means. The weather in Iowa on Monday was about as good as it gets though with bright sunshine, low humidities, a gentle breeze, and comfortable temperatures. The featured chart presents the frequency of various daily summary variable combinations based on period of record data for Des Moines. The black line represents the combined frequency of having a high temperature of at least 75°F, a low temperature below 55°F, a max dew point below 55°F, and an average wind speed below 10 MPH. For this time of year, having such cool overnight temperatures and low dew points are certainly the limiting factors as temperatures and below 10 MPH winds are both above 50%. For those that like hot and muggy conditions, a taste of your perfect weather is upcoming later this week.
Voting: Good - 9 Bad - 0
Generate This Chart on Website
Wed Jun 12, 2024
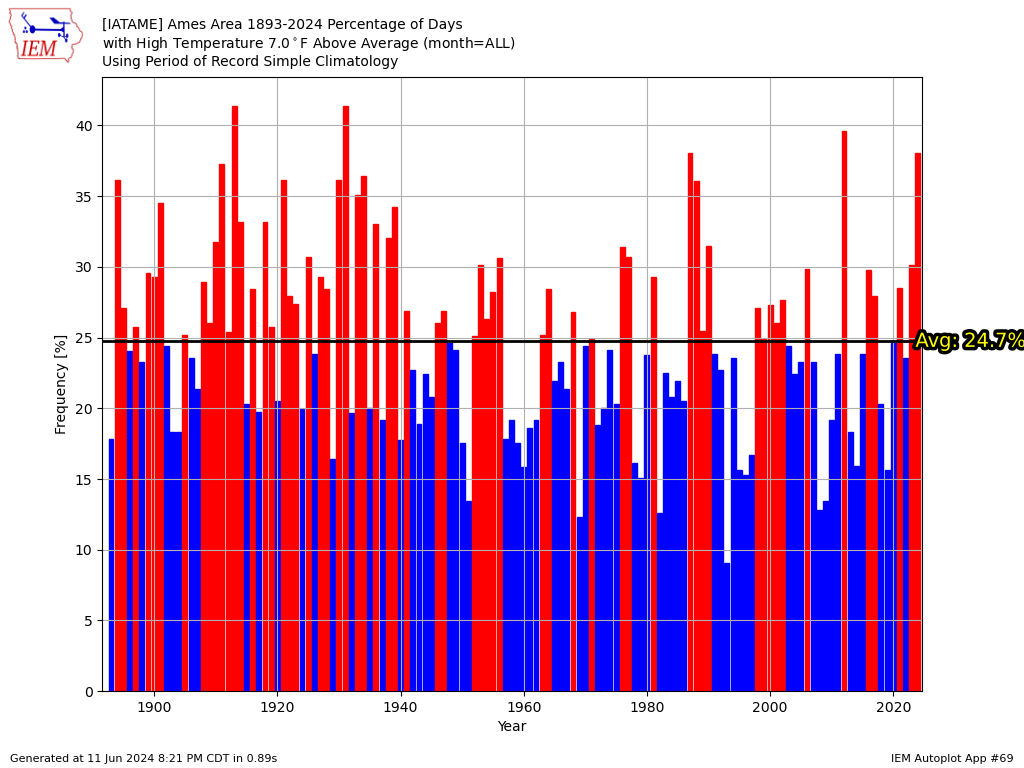
Seven Degrees Above
12 Jun 2024 05:30 AM
The advertised temperature warm up got started on Tuesday with high temperatures reaching 90 degrees for some parts of the state. For Ames, the high temperature was about seven degrees above average for the date. The featured chart presents the percentage of days each year that the high temperature was at least seven degrees above average for the date. The 2024 year to date value is one of the highest on record and well above an overall simple average near 25%. This percentage will only increase over the coming days with plenty of well above average for temperature weather expected.
Voting: Good - 9 Bad - 0
Generate This Chart on Website
Thu Jun 13, 2024
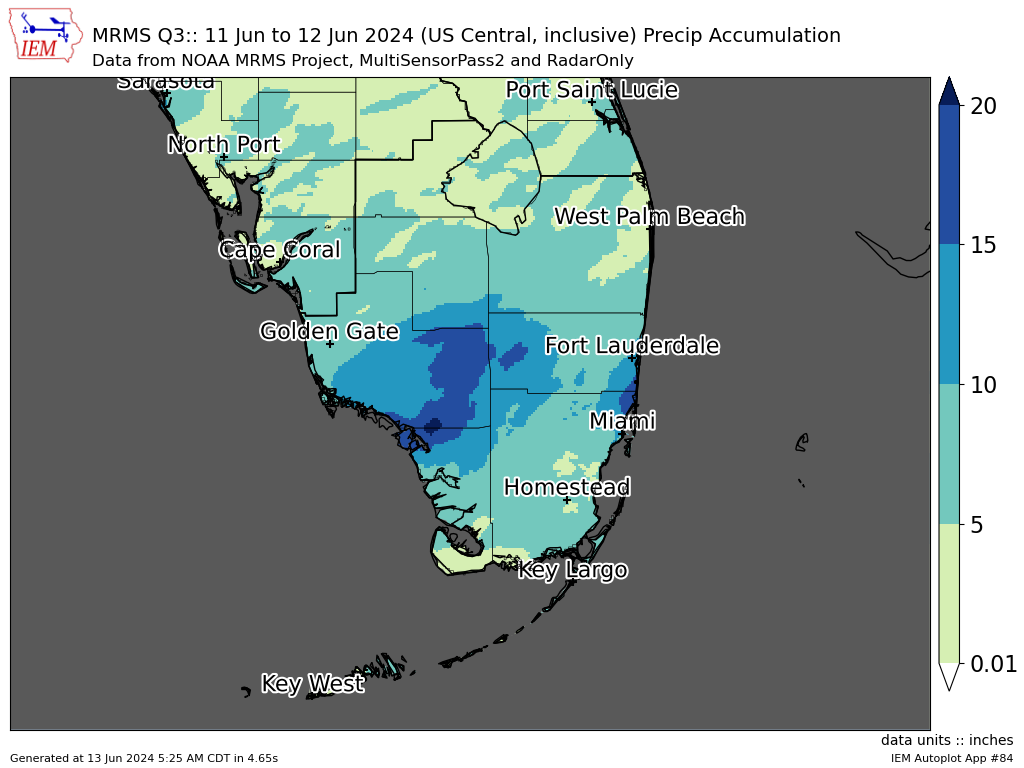
South Florida Deluge
13 Jun 2024 05:30 AM
A stalled out boundary and festering tropical system created a significant deluge of rain over southern Florida on Tuesday and Wednesday. The featured map presents NOAA MRMS estimates over those two days with from five to over 20 inches found over the region. This was all from a tropical system that was unnamed and uncertain future for further development as it moves east and away from Florida. This Hurricane Season is expected to be extremely active was ocean temperatures are some of the warmest on record.
Voting: Good - 10 Bad - 1
Generate This Chart on Website
Fri Jun 14, 2024
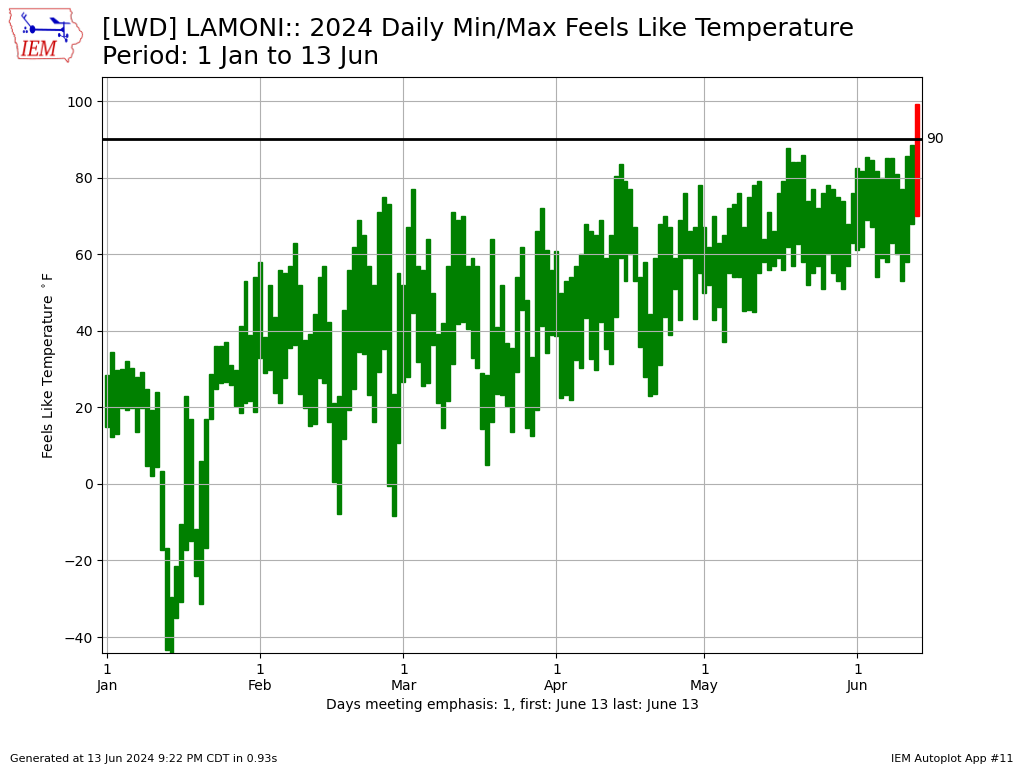
First 90+ Feels Like
14 Jun 2024 05:30 AM
While air temperatures were quite warm on Thursday over Iowa, the worst of the humidity was confined to far southern Iowa. The combination of the two pushed feels like temperatures well into the 90s, with most locations experiencing the hottest conditions so far this year. Such was the case for Lamoni with the featured chart presenting the daily range between the warmest and coolest feels like temperature. Values on Thursday were about 10 degrees warmer than any previous date this year. Storms did fire in the afternoon over southeastern Iowa, being fueled by this steamy air mass. The heat and humidity looks to stick around over the next number of days as full scale summer has arrived for Iowa.
Voting: Good - 12 Bad - 2
Generate This Chart on Website
Mon Jun 17, 2024
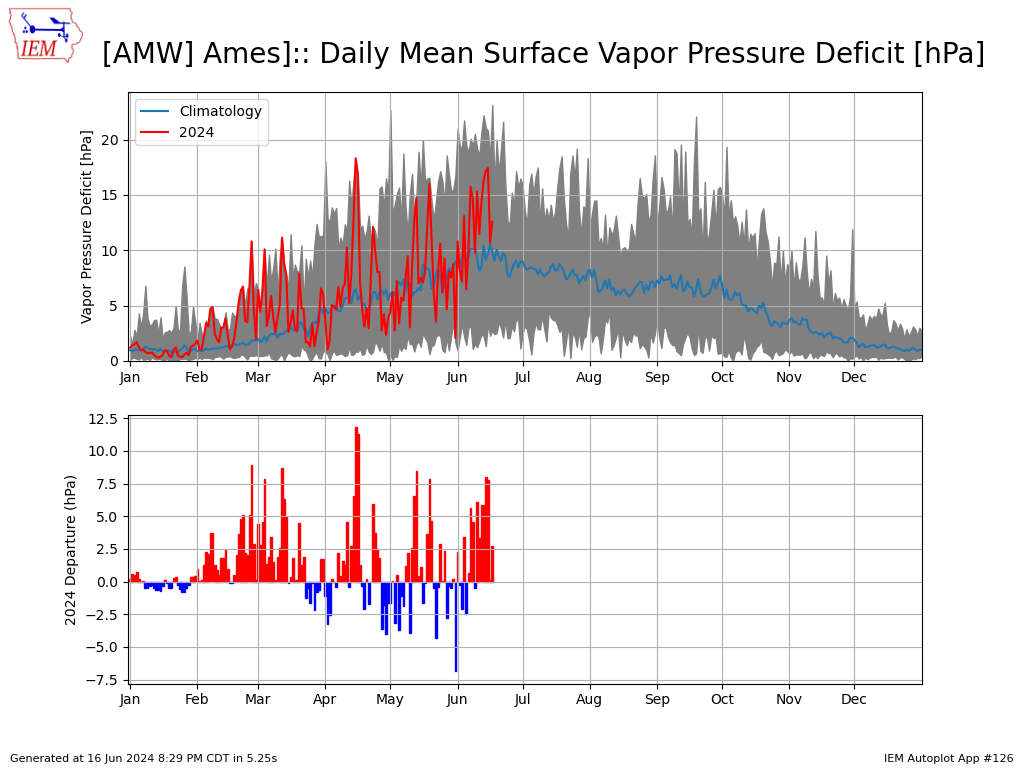
2024 Daily VPDs
17 Jun 2024 05:30 AM
The featured chart presents the daily average Vapor Pressure Deficits (VPD)s for Ames for this year and a climatology based on period of record observations. Large VPD values indicate a larger demand from the atmosphere for water. This demand is based on the availability of the air to hold more water vapor. Saturated air will have a low VPD and thus a low demand for water vapor. The plot for this year tells an interesting story with plenty of days with a larger than average VPD. So even while we have seen a wet spring, there was also been plenty of days with dry air present. The net result becomes worrisome going into June with plenty of drying out of the soil having happened and some areas lacking precipitation as of late. This sets up for a flash drought type situation and undoing the drought busting progress that was done this spring season. The forecast has plenty of chances for rain, but the coverage of these events over Iowa remains in some doubt.
Voting: Good - 11 Bad - 0
Generate This Chart on Website
Tue Jun 18, 2024

Five Days with 70+ Lows
18 Jun 2024 05:30 AM
Some morning storms on Monday helped reinforce a boundary over the state and your location relative to that boundary made a big difference for temperatures felt during the afternoon. South of this boundary, it was another day in the 90s with sticky over night lows mostly in the 70s. For Cedar Rapids, it was the second day with a low temperature of at least 70 degrees. The present forecast for the city has a chance of three more additional days with a low of at least 70. The featured chart presents the day of the year frequency of participating within such a stretch of warm low temperature weather. Overall and thankfully, these events are rather rare. Having such a stretch during mid June would not be without precedent with a handful of previous years having an earlier streak.
Voting: Good - 8 Bad - 0
Generate This Chart on Website
Wed Jun 19, 2024
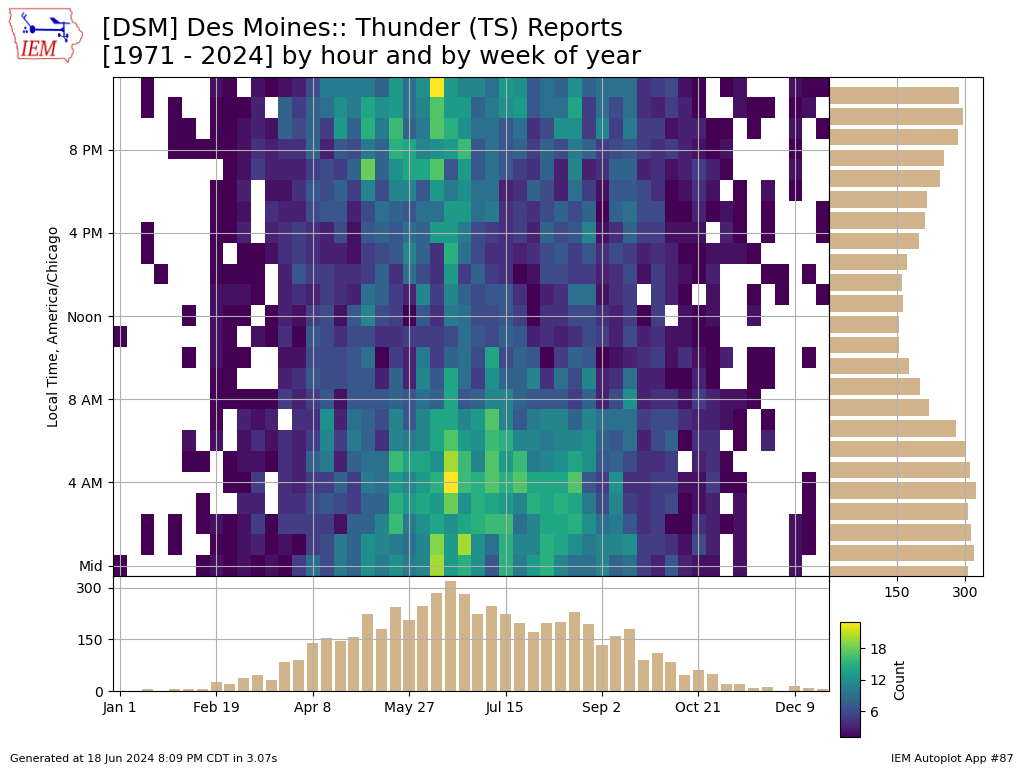
June Peak of Thunder
19 Jun 2024 05:30 AM
While not all parts of the state have seen thunderstorms over the past few hot and steamy days, storms have been frequent each day and have continued overnight and into this morning. The featured chart presents the frequency of having the automated weather station at the Des Moines Airport report thunder. Frequencies are binned by week of the year and hour of the day. The middle of June is the approximate peak in frequency along with the 3-4 AM early morning hours, so the ongoing storms this morning fit this plot well. It is interesting to see the minimum during the noon hour, which some may think as counter-intuitive as that is the approximate hour of peak heating (quasi solar noon). Storms tend to develop after the accumulated effect of the day's worth of heating and associated erosion of an elevated layer of warm air. For Iowa, the overnight maximum is related to the rotation of the "low level jet" with peak transport of unstable low level air into the state during the early morning hours.
Voting: Good - 14 Bad - 0
Tags: thunder
Generate This Chart on Website
Thu Jun 20, 2024
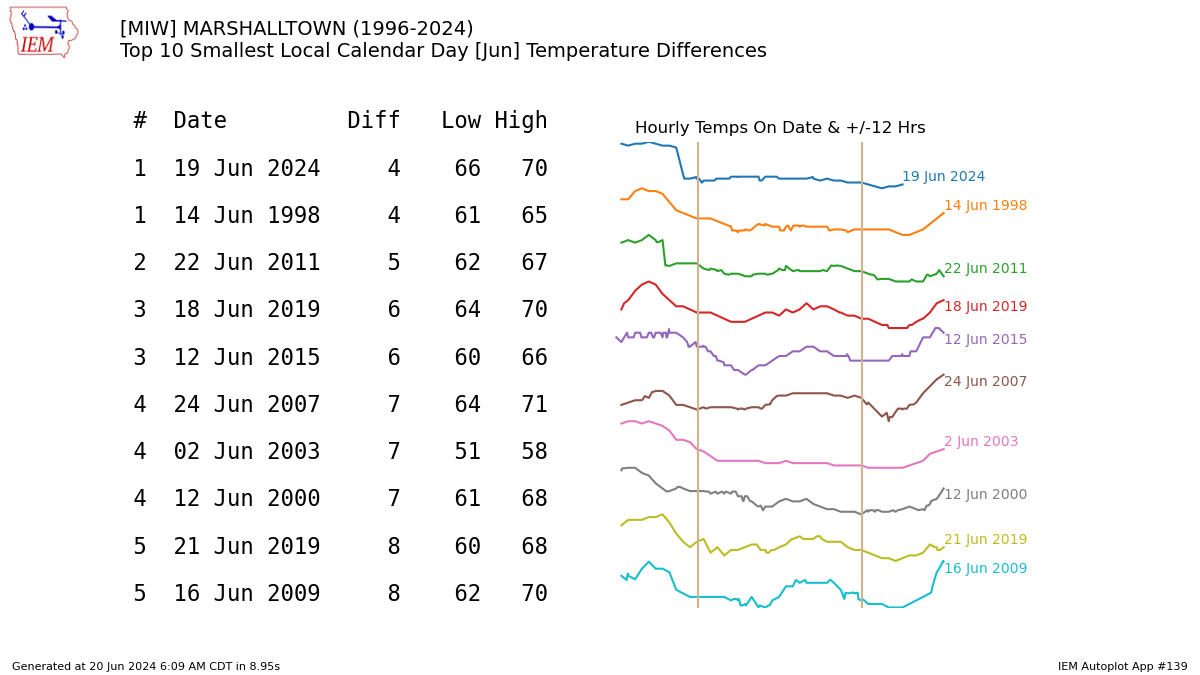
Four Degree Difference
20 Jun 2024 06:16 AM
A meandering frontal boundary continues to bisect the state with a significant difference in sensible weather depending on which side of the boundary you reside! For locations that were close to this boundary on Wednesday, temperatures did not do much thanks to the thick cloud cover. One of those locations was Marshalltown, which only managed a four degree difference between the daily high and low temperature. This is an exceptionally low value for June and during peak solar insolation for the year. The featured chart presents the smallest such daily temperature ranges for the site during June. The sparklines at the side provide a cartoon to show the calendar day temperature pattern for each day.
Voting: Good - 9 Bad - 0
Generate This Chart on Website
Fri Jun 21, 2024
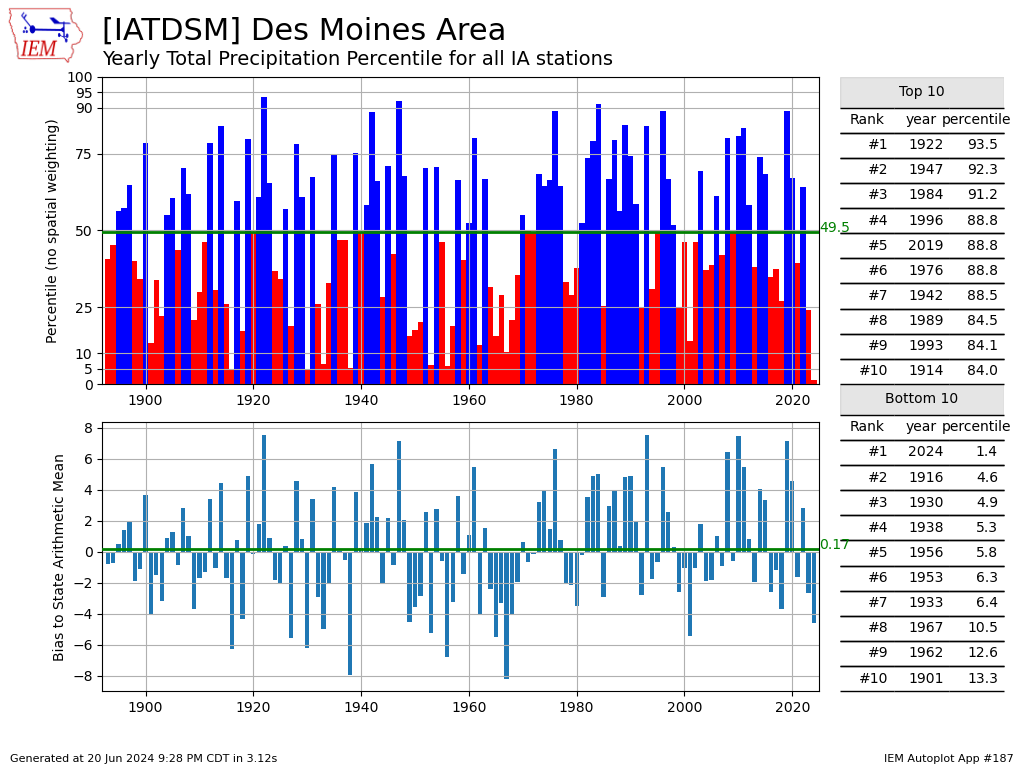
Des Moines on Low End
21 Jun 2024 05:30 AM
For the year to date period, one of the driest locations in the state is the Des Moines Airport. The featured chart looks into the uniqueness of having Des Moines this relatively dry compared with the rest of the state. The top panel presents the yearly precipitation percentile for the location vs all other reporting locations in the state for the given year. The bottom panel shows the bias vs a simple mean value against those same stations. Interestingly, the mean percentile and bias value are very close to the middle of both distributions. Rewording, the geographically center location of Des Moines within Iowa also puts it in the middle of range of precipitation over the state. Indeed, without any notable topographic features, the precipitation climatology is rather smoothly oriented in a SE to NW orientation. The right hand side shows the top 10 and bottom 10 percentile ranks. So the 2024 year to date total ranks lowest vs all other previous full calendar year totals. So it would seem Des Moines is due for a few big storms to even things out against other sites for the year!
Voting: Good - 9 Bad - 0
Generate This Chart on Website
Mon Jun 24, 2024
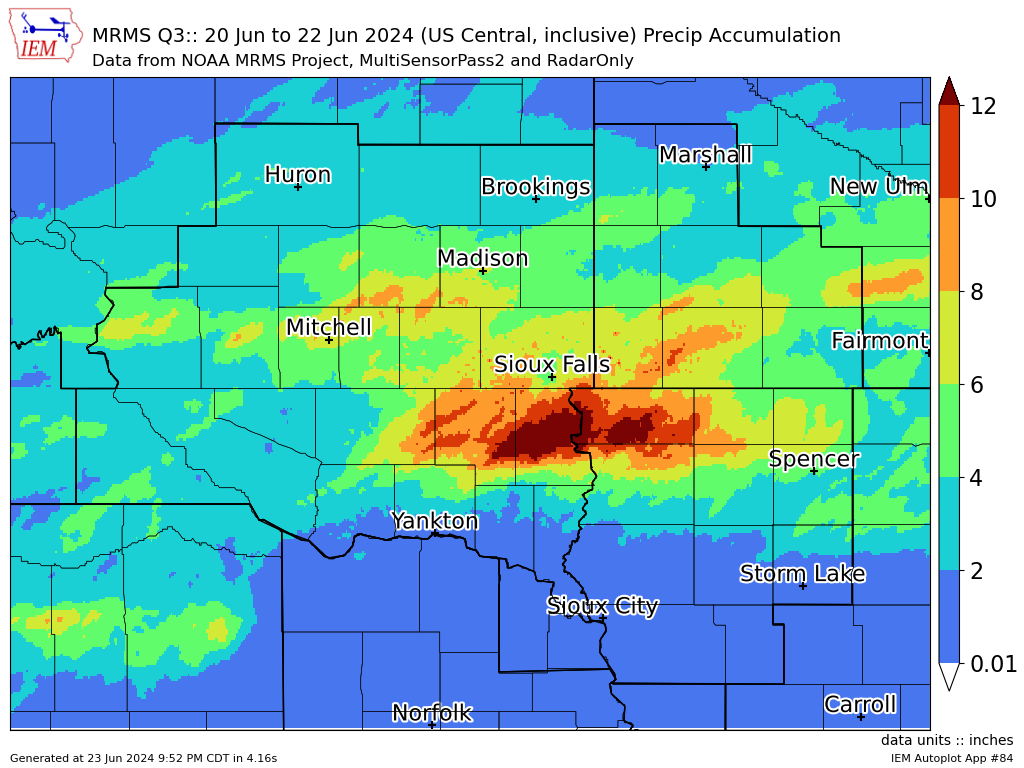
Three Day Total
24 Jun 2024 05:30 AM
Extreme amounts of precipitation fell around the Sioux Falls area on Thursday into Saturday. The featured map presents NOAA MRMS precipitation estimates for this period. A large area received at least six inches of precipitation with a considerable area receiving over a foot. This amount of precipitation over a short duration of time lead to historic flooding of the region. These flood waters are now working downstream into the Missouri River with a number of observation points along area rivers at or near record crests. To make matters worse, dangerous heat will be present on Monday with heat index values well above 100 degrees.
Voting: Good - 16 Bad - 0
Generate This Chart on Website
Tue Jun 25, 2024
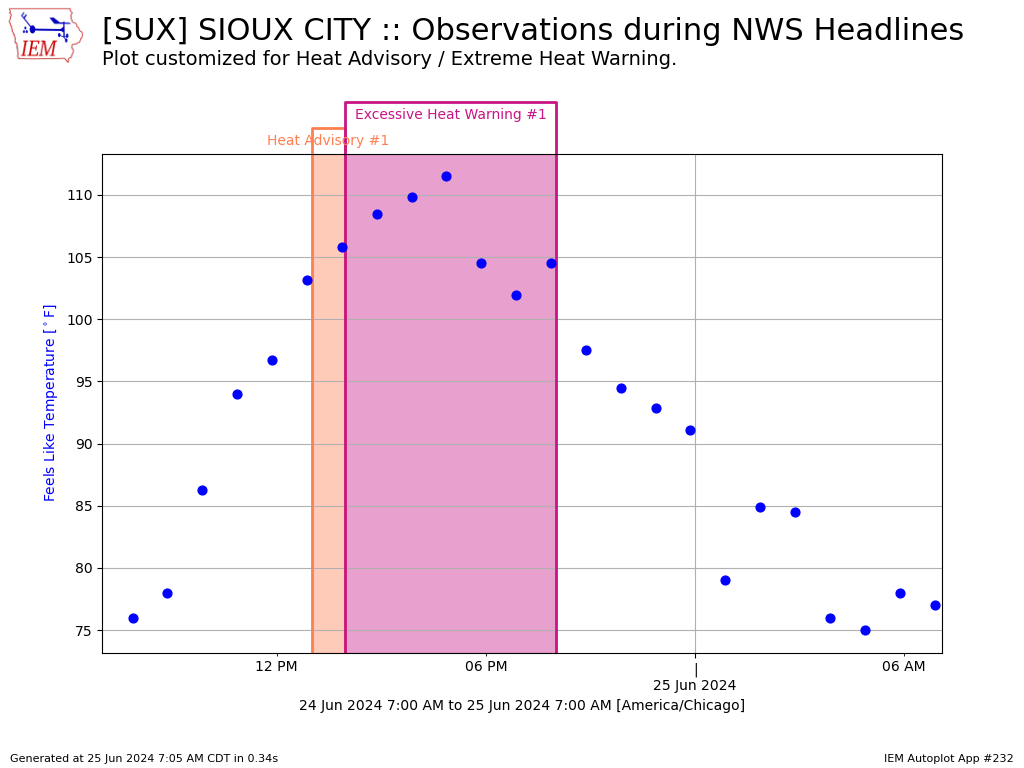
Excessive Heat
25 Jun 2024 05:30 AM
The National Weather Service has two alert types to cover when dangerously hot conditions are forecast, the Heat Advisory and Excessive Heat Warning. These alerts are presently tied to the heat index and have a regional threshold that varies. For Iowa, the Heat Advisory generally covers when the heat index reaches 105 and the Excessive Heat Warning when it exceeds 110. Such was the case in Iowa on Monday with western Iowa receiving the worst of the heat. The featured chart presents the combination of heat index readings for Sioux City and coincident alerts from NWS Sioux Falls. Tuesday will be not quite as warm for most of the state as Monday with a few days of more pleasant temperatures forecast after that.
Voting: Good - 11 Bad - 0
Generate This Chart on Website
Wed Jun 26, 2024
Funnel Cloud Fest
26 Jun 2024 05:30 AM
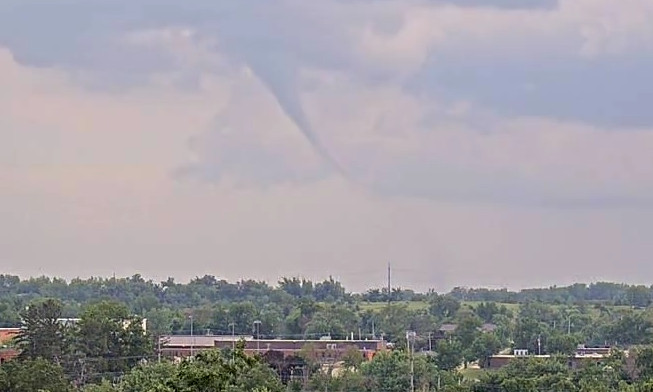
A staled out surface boundary, strong instability, and thunderstorms rapidly developing over top that boundary created ideal conditions for a festival of funnel clouds and even a few brief tornadoes/landspouts over Iowa on Tuesday. The featured image is courtesy of the KCRG-TV webcam in Marion showing a funnel cloud / brief tornado near Ely. Many other funnel clouds were reported along the boundary. A time lapse from the aforementioned brief tornado is available on YouTube. Another time lapse from the Mount Vernon webcam nicely shows a number of funnel clouds.
Voting: Good - 11 Bad - 0
Tags: funnel
Generate This Chart on Website
26 Jun 2024 05:30 AM
A staled out surface boundary, strong instability, and thunderstorms rapidly developing over top that boundary created ideal conditions for a festival of funnel clouds and even a few brief tornadoes/landspouts over Iowa on Tuesday. The featured image is courtesy of the KCRG-TV webcam in Marion showing a funnel cloud / brief tornado near Ely. Many other funnel clouds were reported along the boundary. A time lapse from the aforementioned brief tornado is available on YouTube. Another time lapse from the Mount Vernon webcam nicely shows a number of funnel clouds.
Voting: Good - 11 Bad - 0
Tags: funnel
Generate This Chart on Website
Thu Jun 27, 2024
Late Spring Precipitation
27 Jun 2024 05:30 AM
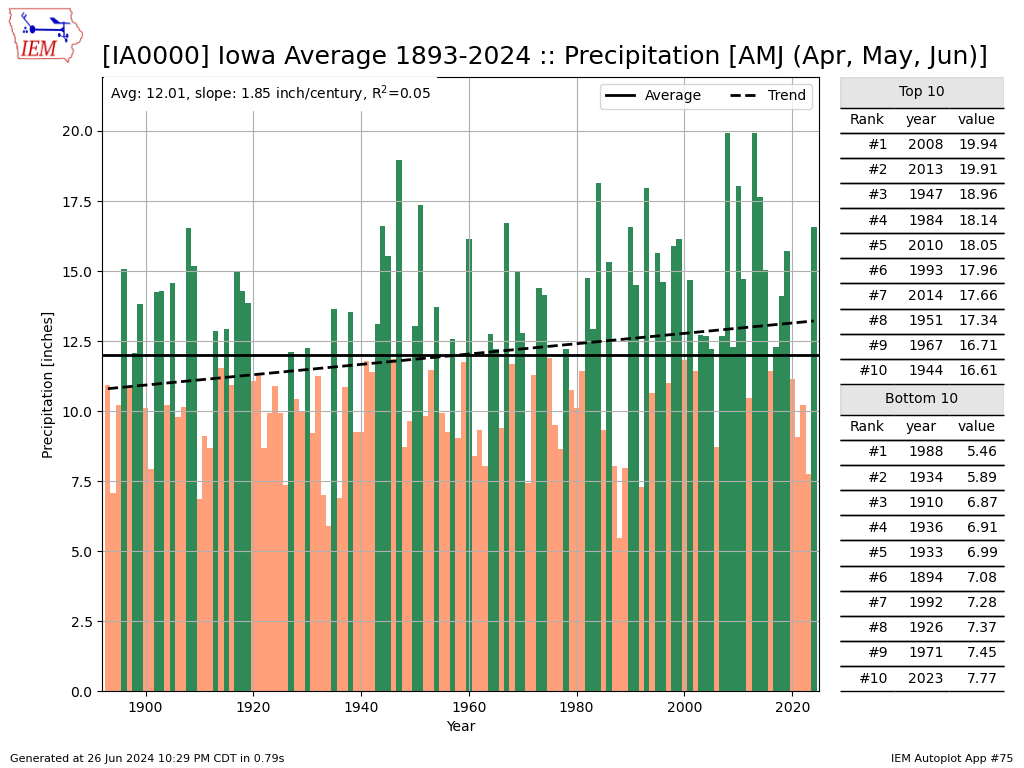
The featured chart presents IEM estimated statewide average total precipitation for April, May, and June. With estimates back to 1893, a simple long term average and trend line is fit to the data with top ten and bottom ten years shown in the table. This year's total is remarkably different than 2023 with last year's total ranking 10th smallest and this year's total just outside of the top 10 largest. All of the rain has certainly put a massive dent into the accumulated drought over the past two years. It has come at the expensive of flooding and a delayed spring planting season. There are more chances of rain yet this June, so perhaps this year's total of 16.56 inches can reach the top 10!
Voting: Good - 12 Bad - 0
Generate This Chart on Website
27 Jun 2024 05:30 AM
The featured chart presents IEM estimated statewide average total precipitation for April, May, and June. With estimates back to 1893, a simple long term average and trend line is fit to the data with top ten and bottom ten years shown in the table. This year's total is remarkably different than 2023 with last year's total ranking 10th smallest and this year's total just outside of the top 10 largest. All of the rain has certainly put a massive dent into the accumulated drought over the past two years. It has come at the expensive of flooding and a delayed spring planting season. There are more chances of rain yet this June, so perhaps this year's total of 16.56 inches can reach the top 10!
Voting: Good - 12 Bad - 0
Generate This Chart on Website
Fri Jun 28, 2024
Comparing to 2023 Arridity
28 Jun 2024 05:30 AM
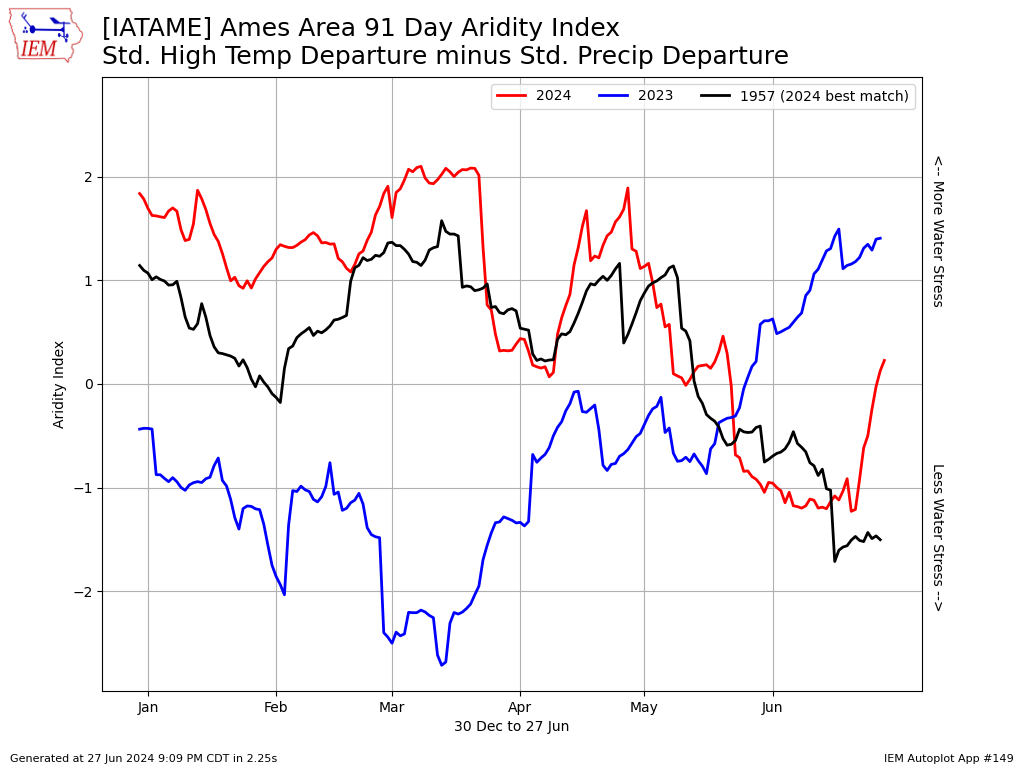
The featured chart presents the aridity index for Ames evaluated over trailing 91 day periods. Aridity combines standard deviation departures of temperature and precipitation attempting to balance the counteracting or combining effects on water demand. For example, hot and dry weather generally creates more water demand from the atmosphere than hot and wet weather. Increasingly positive values indicate more water stress. The chart plots this year's data along with 2023 and a "best match" for 2024 found with 1957. Recently, flash drought concerns have been increasing and the rapid increase in aridity is nicely showing that to be the case. Even with the wet spring, we continue to need timely rains to support crops through the growing season.
Voting: Good - 10 Bad - 0
Generate This Chart on Website
28 Jun 2024 05:30 AM
The featured chart presents the aridity index for Ames evaluated over trailing 91 day periods. Aridity combines standard deviation departures of temperature and precipitation attempting to balance the counteracting or combining effects on water demand. For example, hot and dry weather generally creates more water demand from the atmosphere than hot and wet weather. Increasingly positive values indicate more water stress. The chart plots this year's data along with 2023 and a "best match" for 2024 found with 1957. Recently, flash drought concerns have been increasing and the rapid increase in aridity is nicely showing that to be the case. Even with the wet spring, we continue to need timely rains to support crops through the growing season.
Voting: Good - 10 Bad - 0
Generate This Chart on Website