IEM Daily Feature
Friday, 28 June 2024
Friday, 28 June 2024
Comparing to 2023 Arridity
Posted: 28 Jun 2024 05:30 AM
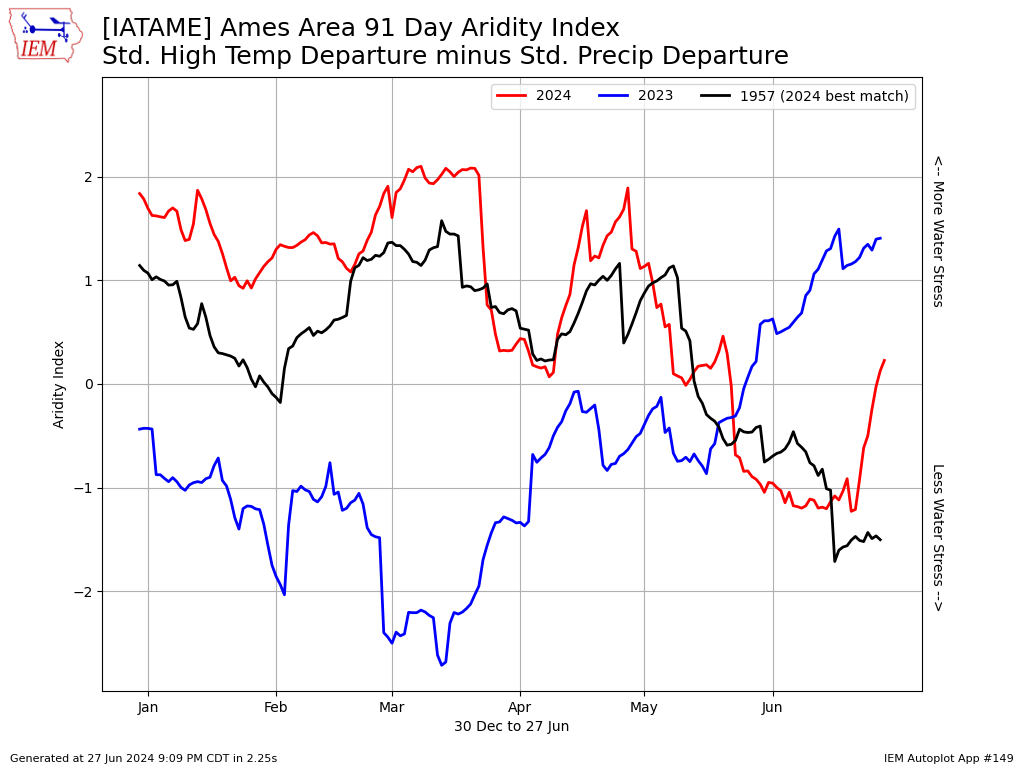
The featured chart presents the aridity index for Ames evaluated over trailing 91 day periods. Aridity combines standard deviation departures of temperature and precipitation attempting to balance the counteracting or combining effects on water demand. For example, hot and dry weather generally creates more water demand from the atmosphere than hot and wet weather. Increasingly positive values indicate more water stress. The chart plots this year's data along with 2023 and a "best match" for 2024 found with 1957. Recently, flash drought concerns have been increasing and the rapid increase in aridity is nicely showing that to be the case. Even with the wet spring, we continue to need timely rains to support crops through the growing season.
Voting:
Good = 10
Bad = 0
Abstain = 1
Voting:
Good = 10
Bad = 0
Abstain = 1