Past Features
This page lists out the IEM Daily Features for a month at a time. Features have been posted on most days since February 2002. List all feature titles.
Wed May 01, 2024
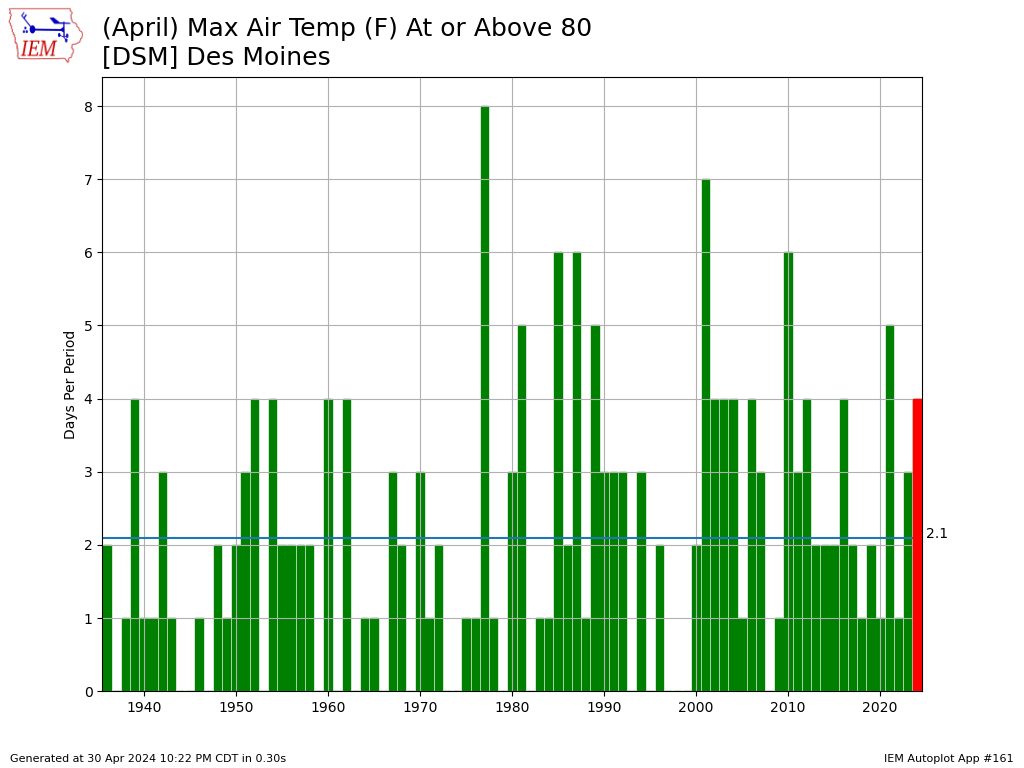
Four Days of 80+
01 May 2024 05:30 AM
The high temperature for Des Moines reached 80 degrees for the last day of April and made for the fourth day of the month with such a warm high temperature. The featured chart presents the number of such days each April for the airport. The average total is just two days, but there have been other recent years with higher totals than this year. The warmth and increased humidity are helping to fuel storms that are putting a dent into the ongoing drought. More storms are in the forecast into the weekend.
Voting: Good - 12 Bad - 0
Generate This Chart on Website
Thu May 02, 2024
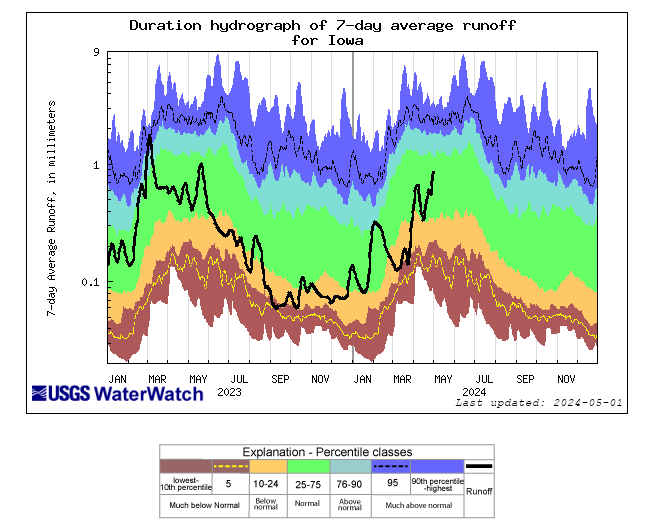
Increasing Runoff
02 May 2024 05:30 AM
The featured chart is courtesy of the USGS WaterWatch website (click toolkit, then state duration hydrograph). The chart shows an estimated statewide averaged runoff value with the y-axis having a logarithmic scale. The chart shows that recent rains have improved the surface hydrologic situation with runoff values somewhere closer to a average value and the largest since last June. Filling area water reservoirs and rivers are both important to many parts of Iowa's economy and providing drinking water to many municipalities. More rain is in the forecast and continued hopes for doing significant drought busting over the coming weeks.
Voting: Good - 12 Bad - 0
Tags: usgs
Fri May 03, 2024
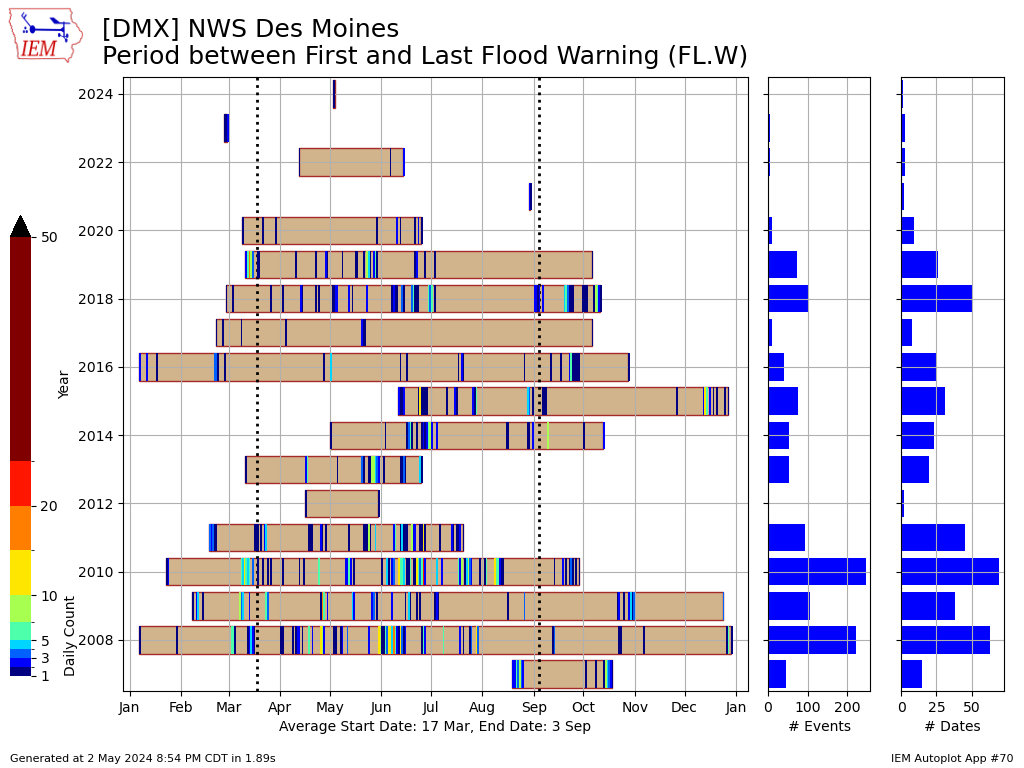
NWS Des Moines Flood Warnings
03 May 2024 05:30 AM
The National Weather Service issues Flood Warnings for monitored points along rivers when the forecast stage (river height) is expected to cause flooding. NWS Des Moines issued their first such warning of the year yesterday for the East Fork of the Des Moines River at Algona. This was the office's first such warning since February of last year! The featured chart presents the period each year between the first and last issuance along with the number of issuances per day. Flood Warnings tend to last many days, so unfortunately this visualization does not represent that aspect of these warnings. Anyway, the chart is still informative when one compares this to years dominated by drought, namely 2012 and a number of recent years. The very wet years of 2008 and 2010 certainly stand out on this chart as well. For recently drought stricken Iowa, a bit of flooding is a good sign that our hydrological situation is improving. Of course, it would be nice if things do not get out of hand over the months ahead.
Voting: Good - 13 Bad - 0
Generate This Chart on Website
Mon May 06, 2024
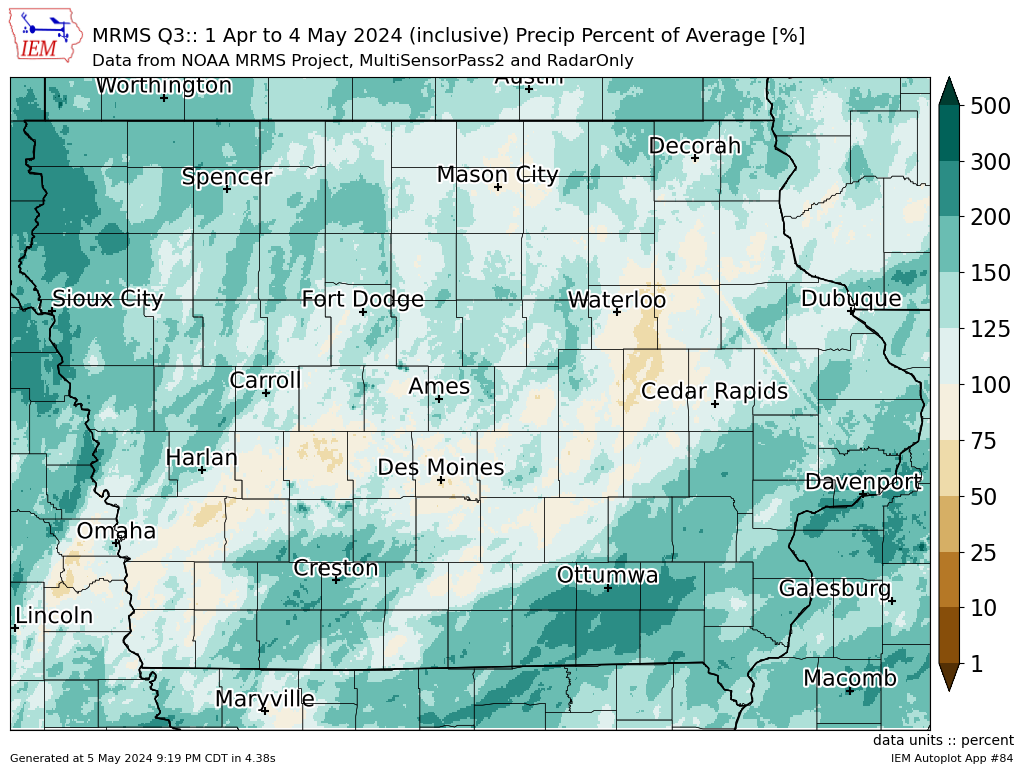
Some Below Average Yet
06 May 2024 05:30 AM
The featured map presents percent of average precipitation since 1 April based on NOAA MRMS estimates compared with a grid analysis of NCEI climatology for the period. Even with all the recent rainfall events, there are still pockets of the state that are considerably below average since 1 April. The area between Cedar Rapids and Waterloo, which was still analyzed as D3 level drought last week, could certainly use more rainfall to make up the short and long term deficits. Far southeastern and northwestern Iowa have seen some of the highest totals for the period. There are more chances of precipitation this week, so hopefully these deficits can be improved.
Voting: Good - 15 Bad - 0
Generate This Chart on Website
Tue May 07, 2024
Above average counts
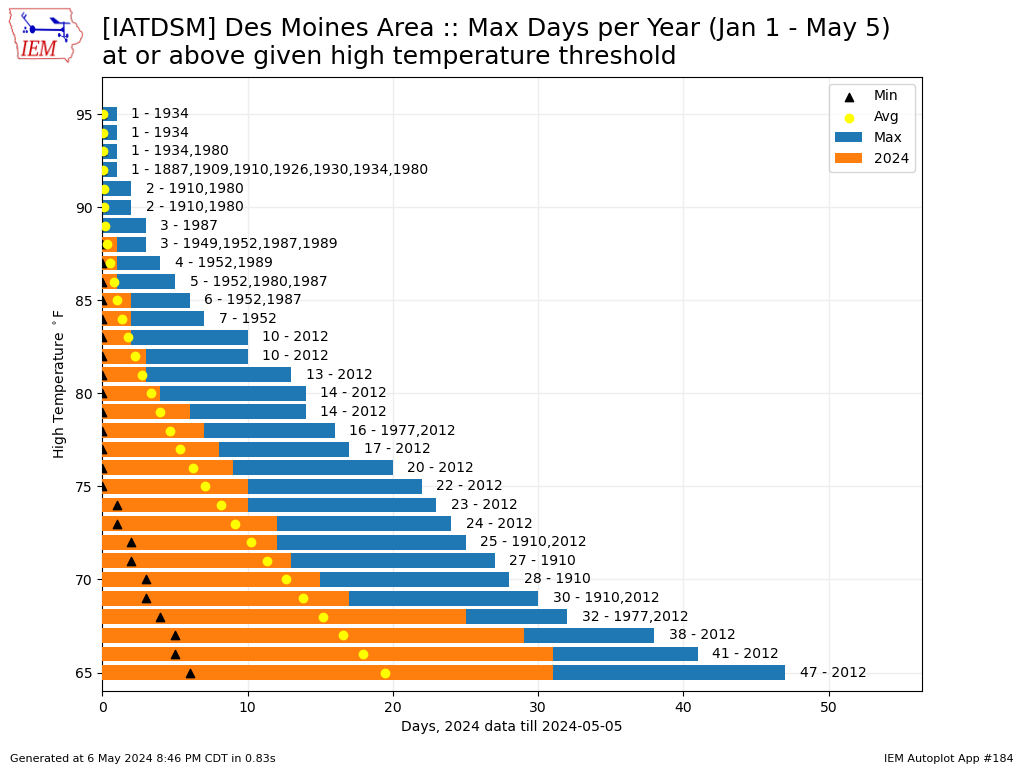
07 May 2024 05:30 AM
While windy, Monday turned out to be a warm day for early May with highs into the 70s. The featured chart presents the year to date accumulated number of days with a high temperature of at least the given threshold for Des Moines. The orange bars represent the 2024 totals with the yellow dots representing an average value. The fewest days on record is denoted by the triangle and most by the full blue bar. The year of the max value is labelled. For values below 70 degrees on this chart, this year has seen plenty more days than average. For days above 80, we are much closer to average. This is certainly a good time of year to have extra warmth to help vegetation and crops get established and avoid chilly conditions.
Voting: Good - 13 Bad - 0
Generate This Chart on Website
Wed May 08, 2024
Another 100+ Tornado Warning Day
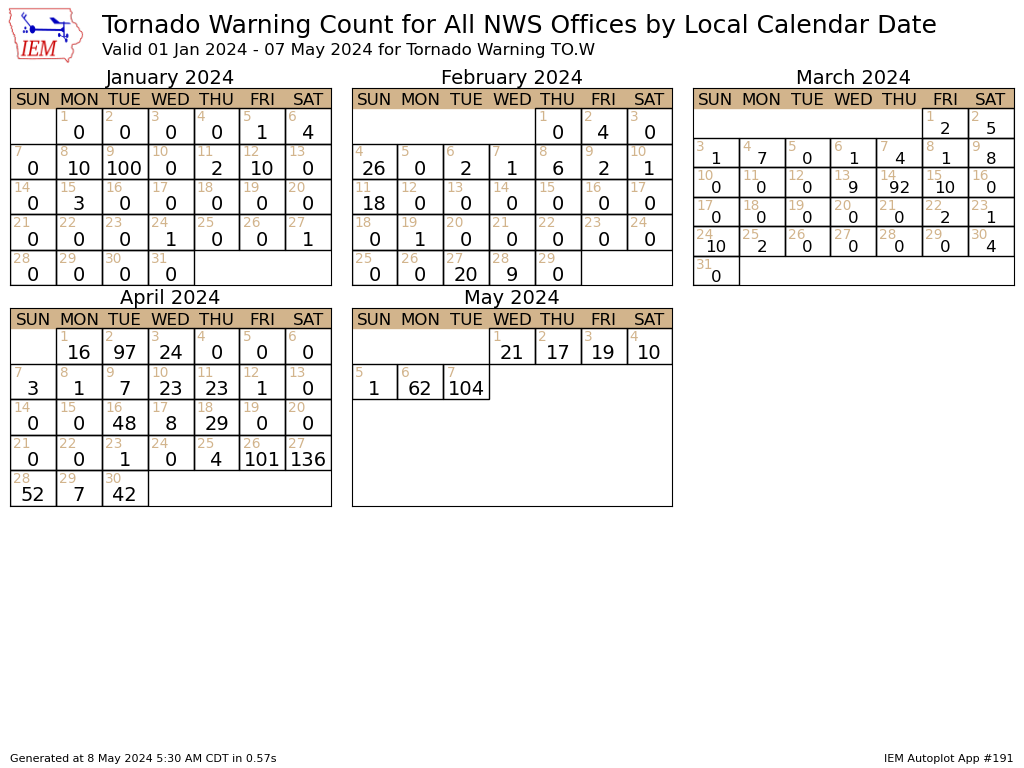
08 May 2024 05:30 AM
While it is the heart of severe weather season, the recent two weeks have still been quite active across the country. The featured chart presents an IEM accounting of the number of NWS Tornado Warnings issued by calendar day (US Central timezone). The total for yesterday made for the fourth day of 2024 with over 100 tornado warnings issued. Yesterday also featured the first tornado emergency for the state of Michigan. Again, based on unofficial IEM archives, the record for number of 100+ tornado warning days is nine days during 2011. The second highest total was five days during 1998, 2003, 2005, and 2006.
Voting: Good - 11 Bad - 0
Generate This Chart on Website
Thu May 09, 2024

Driest areas need more rain
09 May 2024 05:30 AM
The weekly update to the US Drought Monitor is due out later this morning and will likely show improvements over the state after all of the recent rains. Even with all of the recent rain, there are still areas of the state that have not fared as well as others. There's a lot going on with the featured map. It presents three trailing precipitation departures over 30, 60, and 90 days with the color coding representing standardized precipitation departures expressed in drought categories. Note that there is no one to one relationship between analyzed drought and a precipitation departure, but it can be an indicator. The shaded regions are the drought classifications from last week's update. Of note are the driest areas over eastern Iowa that have not had significant positive departures over the past 90 days. They have been "treading water" so to speak with average accumulations, so by attrition, the drought situation has improved in these areas.
Voting: Good - 15 Bad - 0
Generate This Chart on Website
Fri May 10, 2024

Soon to be Summer
10 May 2024 05:30 AM
This is Finals Week for Iowa State University and others in the state, so the feeling of summer is starting to set in. Some say the official start of summer is Memorial Day and others point to the summer solstice. For a data driven determination of the warmest 91 day period of the year, today's featured chart provides an answer. The chart plots the start day each year of the warmest 91 day stretch for a statewide areal averaged temperature for Iowa. The given summer's average temperature departure from a long term average is provided by the dot's color. A simple linear long term trend line is fit to the data as well. There is certainly a lot of spread for this date with a range from mid May to the end of June. The simple average is 8 June, so there is still time to enjoy the spring season.
Voting: Good - 13 Bad - 0
Generate This Chart on Website
Mon May 13, 2024

On-track Soil Temps
13 May 2024 05:30 AM
The featured chart presents daily four inch depth soil temperatures from the ISU Ag Farm west of Ames. The red line shows the 2024 observations with the tan bars representing the range over the period of record and green bars showing the range between the 25th and 75th percentiles. The black line is a simple daily mean with this year's value recently tracking along with climatology. Soil temperatures certainly have not been a factor with slowing spring planting progress. The persistent recent rainfalls have and look to continue this week.
Voting: Good - 11 Bad - 0
Generate This Chart on Website
Tue May 14, 2024
Warm for Mothers Day
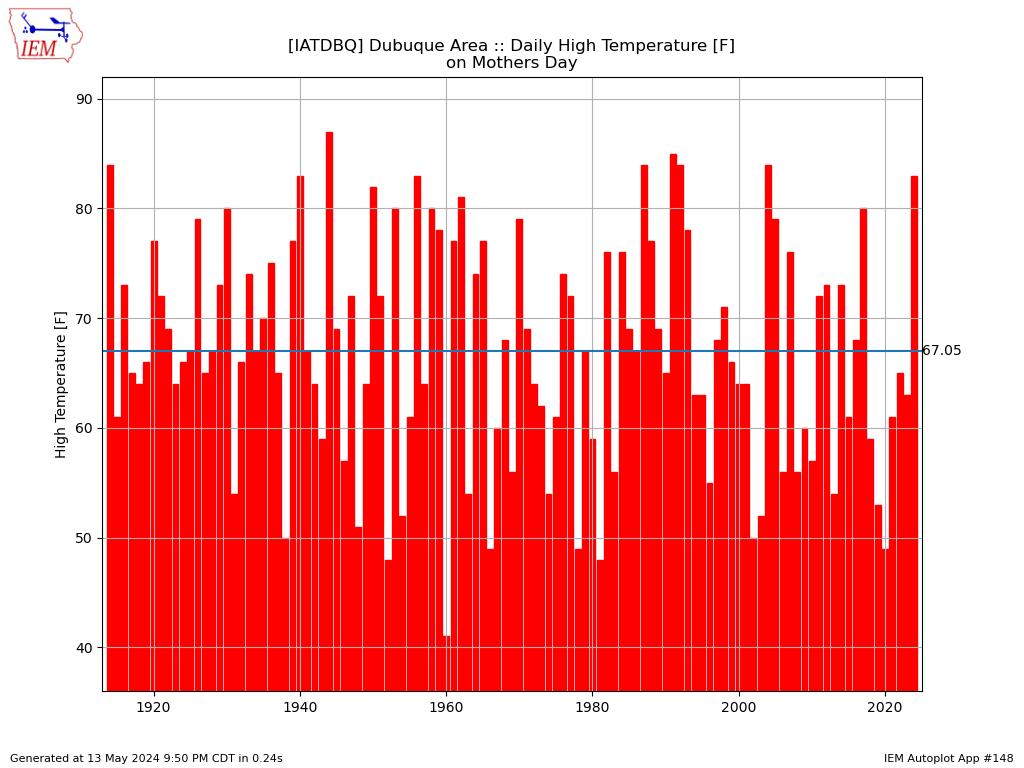
14 May 2024 05:30 AM
Temperatures were very warm on Sunday for Mothers Day. Dubuque reported a high temperature of 83 degrees. The featured chart presents the Mothers Day high temperatures for Dubuque since the day's inception. The simple average is just 67 degrees, so 83 is well to the high end of what can be expected for the date. Temperatures cooled a bit for Monday and are expected to remain in the 70s for much of this week before more 80s arrive for the weekend.
Voting: Good - 6 Bad - 0
Generate This Chart on Website
Wed May 15, 2024

Unhealthy Air Quality
15 May 2024 05:30 AM
The past two days have seen a noticeable increase in wildfire smoke and the associated decrease in air quality. Here at ISU on the top of Agronomy Hall, we have a Purple Air air quality sensor and the IEM has started a recent ingest of this sensor's data. The featured chart presents the daily range between the best and worst PM2.5 Air Quality Index (AQI). The colorized ranges are based on the AQI Basics found on the airnow.gov website. The chart shows the creep into the unhealthy category over the past few days. Air quality is expected to improve on Wednesday as wind directions shift. At the moment, you can't find much tooling for this data on the IEM website. There is only a crude download option.
Voting: Good - 16 Bad - 0
Tags: aqi
Thu May 16, 2024
Possible 90 Day Departures
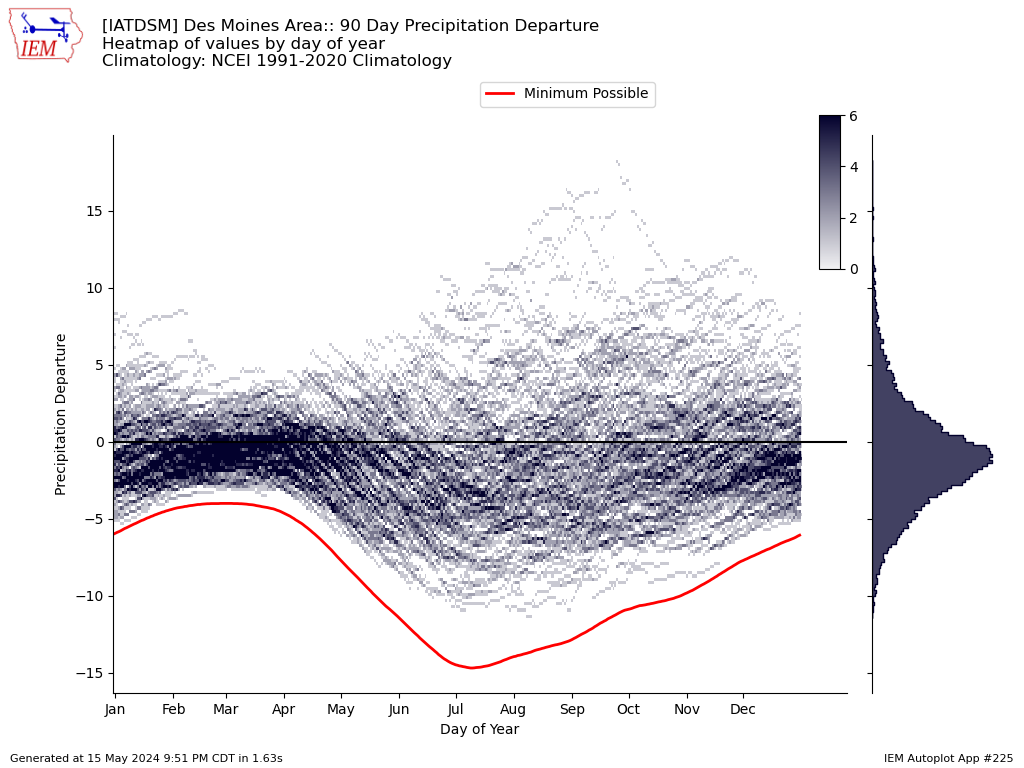
16 May 2024 05:30 AM
Precipitation departures are an interesting statistic. Unlike temperature departures which tend to have equal magnitude departures possible in both cool and warm directions, negative precipitation departures are bounded by climatology (i.e. you can't have a negative departure). Rewording, if your climatological average precipitation for the month is three inches and you receive zero, the maximum below average departure possible is three inches. The featured chart takes a bit of a deep dive into 90 day trailing precipitation departures by day of the year for Des Moines. The data is presented as a heat map, which represents the number of times (read years) a given departure has happened on the given date. There are many neat aspects found in the chart. The red line represents the maximum negative departure over 90 days when the observed precipitation is zero. Since we get much less precipitation during the cold season, the largest possible negative values are much smaller. And accordingly, the largest observed positive departures are much smaller as well. The right hand histogram shows that most of the distribution is found below 0, which is a sign that the precipitation distribution is skewed and not normally distributed. Another interesting aspect are the downward streaks found during April into the July. These are due to climatology slowly increasing each day, so dry days will more rapidly pull departures more negative than during other times of year.
Voting: Good - 8 Bad - 0
Tags: precip
Generate This Chart on Website
Fri May 17, 2024

Comfortable May Dew Points
17 May 2024 05:30 AM
The featured chart presents an IEM computed maximum hourly dew point temperature for Des Moines between 1 and 16 May each year on record. The max dew point for this May is only 61°F, which matches the minimum for a couple of recent years. A noticeable plot outlier is 2010, which had a number of chilly days during the first half of the month. This is a good time of year for warm temperatures and not too bad humidity levels. This certainly changes as we move toward June, so get out to enjoy it now!
Voting: Good - 14 Bad - 0
Generate This Chart on Website
Mon May 20, 2024

Avoided May Cold
20 May 2024 05:30 AM
The featured chart looks into spring season periods with four inch depth soil temperatures around 50 degrees. For each year on record for the Ames Ag Farm Ag Climate / Soil Moisture site, the first period lasting at least 48 hours with the soil temperature above 50°F is colored red, then any subsequent periods below 50°F are colored light blue. If those periods last more than 24 hours, they are colored dark blue. For this year, there was only a brief period toward the end of April with such chilly soil temperatures. The entire month of May has seen temperatures above 50°F at a four inch depth.
Voting: Good - 11 Bad - 0
Generate This Chart on Website
Tue May 21, 2024
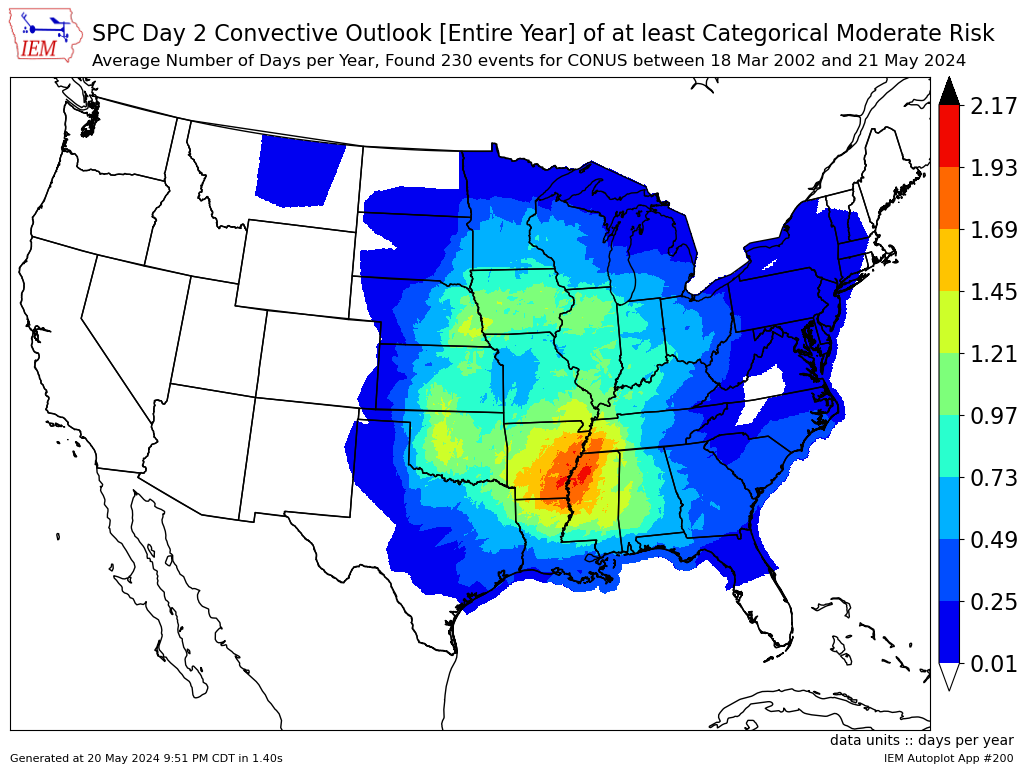
Day 2 Moderates
21 May 2024 05:30 AM
The Storm Prediction Center issued a Day 2 Moderate Risk yesterday for most of southeastern Iowa on Tuesday. The featured map presents a heat map of such risks expressed as average number of days per year at such a threshold. Much of Iowa is shown around the one day per year frequency with the highest frequencies found over Arkansas into Mississippi. The afternoon storm threat is conditional on how the morning storms play out and what surface air mass boundaries they create for later afternoon storms to deal with. All of the severe weather threats of large hail, damaging winds, and tornadoes are expected throughout much of the day and into the evening.
Voting: Good - 18 Bad - 0
Tags: spc moderate
Generate This Chart on Website
Wed May 22, 2024
May 21
22 May 2024 05:58 AM
The severe weather threat on Tuesday materialized and then some with numerous damaging tornadoes reported along with wind, hail, and flooding rains. The featured movie lapses a NEXRAD mosaic between 10 AM and midnight with NWS Local Storm Reports plotted. The event got started early and storms moved very quickly off to the north and east. An interactive map is available of this event detailing the warnings issued and local storm reports received by the NWS.
Voting: Good - 15 Bad - 0
Tags: may212024
Thu May 23, 2024
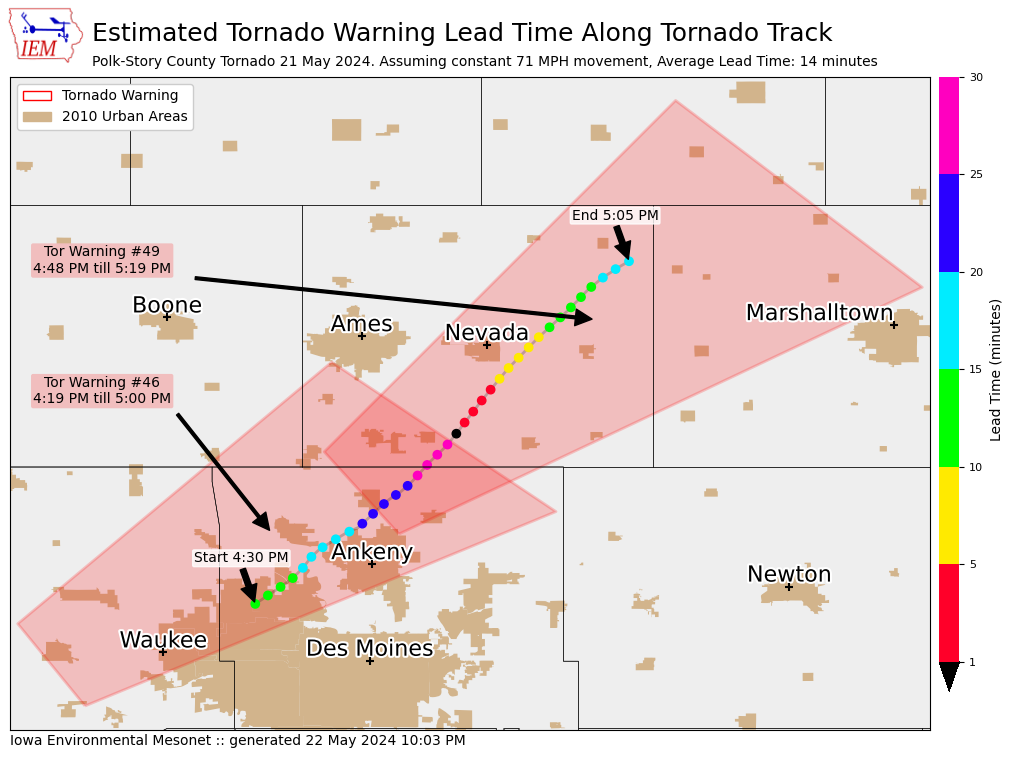
Polk-Story Tornado
23 May 2024 05:30 AM
After damaging tornadoes, the National Weather Service conducts damage surveys to document the tornado track and produce EF-scale ratings based on damage indicators found during the survey. On Wednesday, NWS Des Moines released a preliminary survey track for the tornado that tracked from near Grimes to Zearing. The featured map combines this track along with its estimated start/end times and underlays the two tornado warnings covering this event. The track is discretized into one minute interval points with each point evaluated for lead time with the associated first overlapping warning. The map is attempting to illustrate the varying lead time somebody along this track may have experienced. There are many caveats to a map like this as somebody just outside of the first warning would still have likely experienced a heads up with a greater lead time that is shown by the plot. This tornado is currently rated as a EF-2. Additional damage surveys will come up over the coming days, including the most significant tornado directly hitting Greenfield. Here are links to NWS Des Moines, NWS Davenport, and NWS La Crosse event summary pages.
Voting: Good - 23 Bad - 1
Tags: may212024
Generate This Chart on Website
Fri May 24, 2024
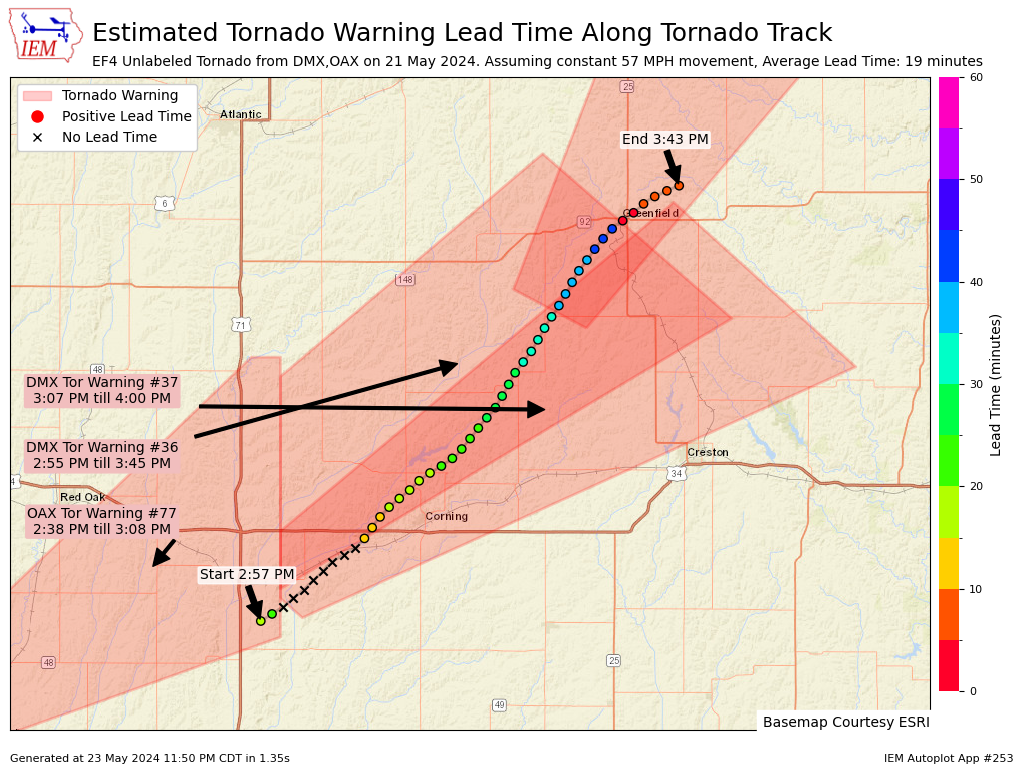
Greenfield Tornado
24 May 2024 05:30 AM
Yesterday's daily feature map of the Polk/Story Tornado Track from Tuesday was well received, so today's map shows the current and preliminary NWS track for the tornado that hit Greenfield, IA. The map combines NWS Tornado Warnings with the tornado track and attempts to assess lead time at one minute interval points along the track. There are caveats galore with this type of analysis as the algorithm assumes a constant ground speed and has a very rigid and binary spatial/temporal match between the track points and the polygons. For example, the x's indicate times that the tornado was temporally and spatially outside of the warning, but there was an active warning less than 0.5 miles to the west. Additionally, the points near Greenfield are shown with a very short lead time, but previous warnings were within a mile with plenty of lead-time. So for what it is worth, you can now generate these maps on-demand for other tornado tracks found within the NWS Damage Assessment Toolkit (DAT).
Voting: Good - 33 Bad - 1
Tags: dat may212024
Generate This Chart on Website
Tue May 28, 2024
Awaiting A Big Week
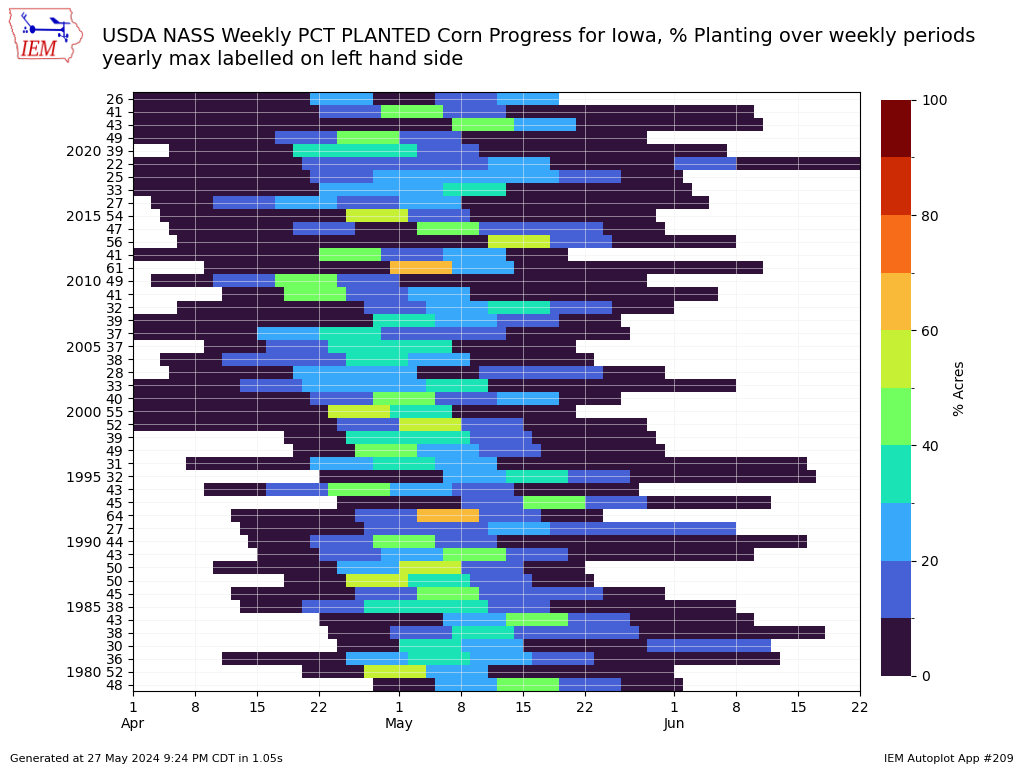
28 May 2024 05:30 AM
With the Memorial Day holiday on Monday, the weekly USDA NASS release is pushed back a day to Tuesday and will likely not show much in the way of planting progress for Iowa. Farmers continue to wait for fields to dry out and the hope to string a number of good weather days together to make for a big week of field work progress. The featured chart presents the weekly estimated corn planting progress from USDA NASS. The bars represent the percentage point change in corn planting progress or rewording, the percentage of the corn crop planted over the seven day period. The maximum value each year is labelled on the left and this year's value of just 26% is below most of the biggest weeks found during previous years.
Voting: Good - 8 Bad - 0
Tags: nass
Generate This Chart on Website
Wed May 29, 2024
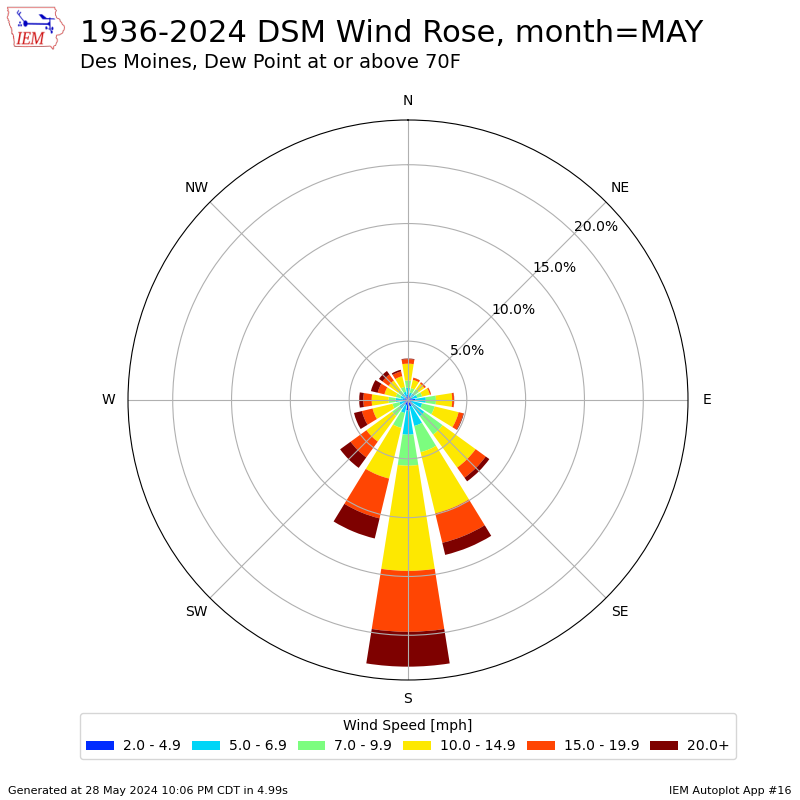
May Winds with 70+ Dew Points
29 May 2024 05:30 AM
Much of May has seen very comfortable temperatures and even with all of the rainfall, humidity levels have not been all that extreme with only the 21st reaching a 70°F dew point for Des Moines. Such high dew points in May almost always require transport of warmer and more humid air masses from our south and sourced from the Gulf of Mexico. Later in the summer season, aggressive crop transpiration and warmer temperatures can help push such dew points without much help from our south. Back to May, the featured wind rose plots the wind speed and direction reports for Des Moines when the coincident dew point is at least 70°F. The southerlies certainly dominate and any of the other directions are likely transient during low speed times and during frontal/storm passages.
Voting: Good - 15 Bad - 0
Tags: may
Generate This Chart on Website
Thu May 30, 2024
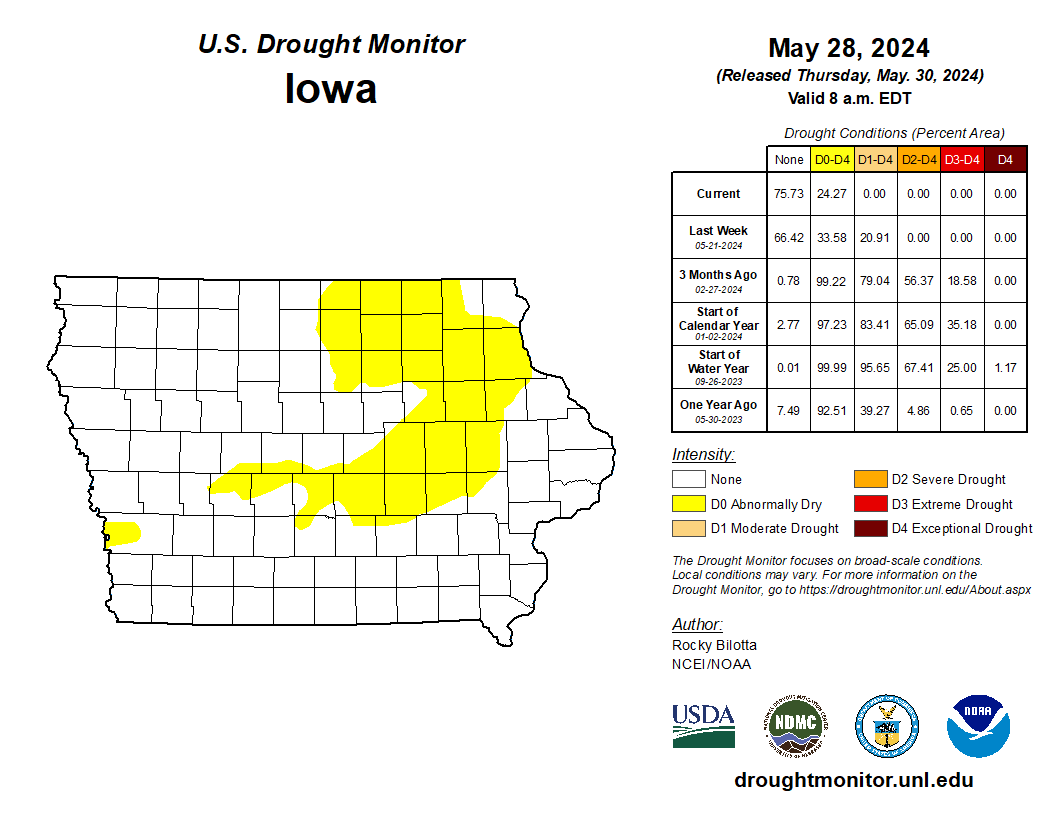
Goodbye D1 Drought
30 May 2024 08:19 AM
The featured graphic is courtesy of the excellent US Drought Monitor website. The weekly update was just released and all of the D1 drought classification has been removed from Iowa! This is the first Iowa has been free of D1 since summer of 2020. The remaining abnormally dry areas are denoting the very significant long term departures that accumulated last year. Needless to say, significant drought busting has occurred during April and May with precipitation totals at record high value for many parts of the state.
Voting: Good - 11 Bad - 0
Fri May 31, 2024

Accumulated SDDs
31 May 2024 05:30 AM
Much of May has featured very comfortable temperatures with our recent stretch of daily highs in the 70s finishing off the month. June is certainly when summer heat and humidity starts to settle in and today's featured chart looks into a measure of heat being Stress Degree Days (SDD)s. Much like Growing Degree Days, SDDs accumulate daily heat units above some threshold, which is typically chosen as 86°F. For corn, values above this threshold tend to cause plant stress and are considered detrimental to yield. The featured chart presents yearly accumulated SDDs for Ames with a simple average shown in red. This parameter does not accumulate much prior to the last week of May and begins a sharp increase into June and through July and August before slowing by the second week of September. The forecast for next week has warmer temperatures and perhaps a few days approaching high temperatures of 86°F.
Voting: Good - 14 Bad - 0
Tags: sdd
Generate This Chart on Website