Past IEM Features tagged: sdd
SDD Ranks
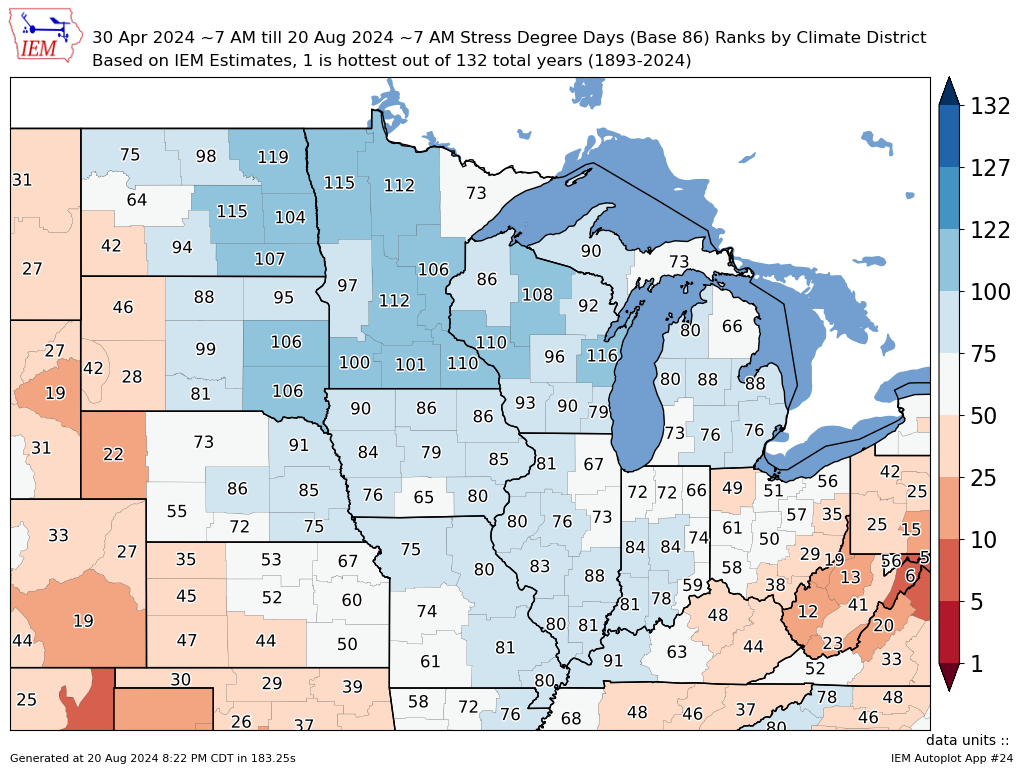
21 Aug 2024 05:30 AMWhile we have seen brief periods with very hot weather, much of this summer has been quite comfortable with yesterday being another such day with highs generally in the 70s. One quantitative measure of how much hot weather there has been can be found with Stress Degree Days (SDD)s. The common equation to compute this value is to sum the difference from 86°F any days with a high above above that threshold. For example, a day with a high of 88°F would accumulate two units whereas a day with a high of 78°F would accumulate zero. The featured chart computes ranks for accumulated SDDs by climate district for the summer to date. A rank of one would indicate the largest SDD accumulation on record being this year and a rank of 132 being the smallest since 1893. The map of unofficial IEM estimates indicates very little SDD concerns over nearly all of the corn belt with values just or well below average.
Voting:
Good: 14
Bad: 0
Tags: sdd
Accumulated SDDs
31 May 2024 05:30 AMMuch of May has featured very comfortable temperatures with our recent stretch of daily highs in the 70s finishing off the month. June is certainly when summer heat and humidity starts to settle in and today's featured chart looks into a measure of heat being Stress Degree Days (SDD)s. Much like Growing Degree Days, SDDs accumulate daily heat units above some threshold, which is typically chosen as 86°F. For corn, values above this threshold tend to cause plant stress and are considered detrimental to yield. The featured chart presents yearly accumulated SDDs for Ames with a simple average shown in red. This parameter does not accumulate much prior to the last week of May and begins a sharp increase into June and through July and August before slowing by the second week of September. The forecast for next week has warmer temperatures and perhaps a few days approaching high temperatures of 86°F.
Voting:
Good: 14
Bad: 0
Tags: sdd
Daily Stress Degree Days
07 Aug 2019 05:35 AMStress Degree Days (SDD) is an index comparing the daily high temperature to some base temperature. Accumulated over time, it can be an effective measure of how much stress was experienced due to really hot temperatures. A common base temperature used with plants like corn is 86F. The featured chart looks at the daily climatology of SDDs along with the actual daily values for Ames so far this year. The red line shows the simple daily average based on period of record data. It is kind of interesting to see the flatness of that line during August and into September. Elevated levels of humidity during this period is likely the explanation as it acts to suppress really hot temperatures.
Voting:
Good: 12
Bad: 0
Tags: sdd
Stressing Out
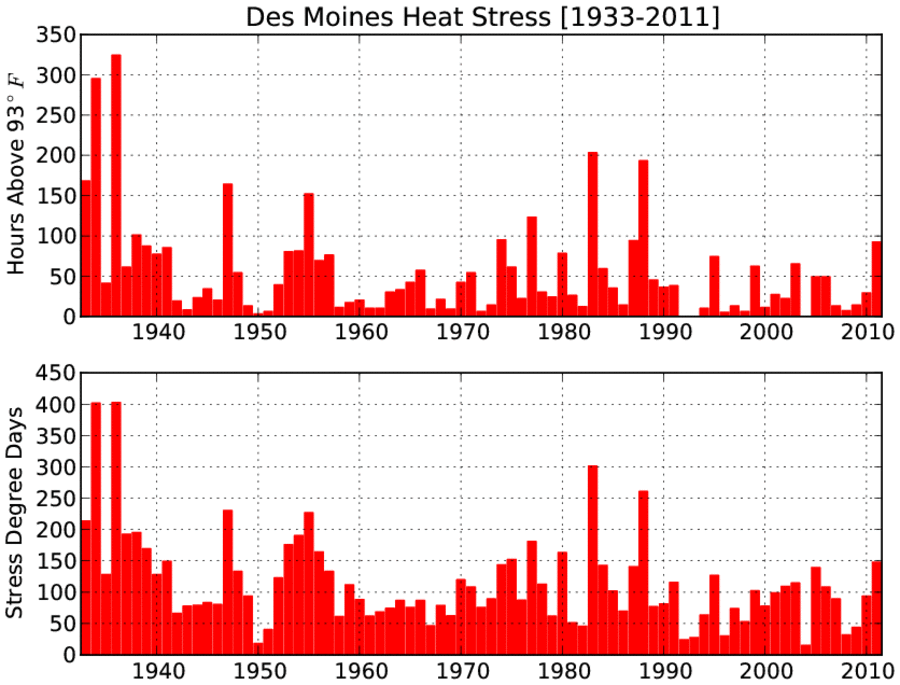
28 Sep 2011 05:38 AMThis year has certainly seen its share of hot weather as compared with recent years. The featured chart presents two measures of heat stress. The top panel is the number of hours where the temperature was at or above 93 based on data from the Des Moines Airport sensor. The bottom panel presents the traditional stress degree days, which is a measure of the exceedance of 86 by the daily high temperature. For both measures, this year has been the warmest since the drought year of 1988. The largest values, by a large margin, on the chart are from the dust bowl in the 1930s.
Voting:
Good: 17
Bad: 4
Tags: sdd
Few SDDs
19 Aug 2009 06:12 AMStress Degree Days are an indicator of the stress plants may experience due to excessive heat. The statistic is computed by adding up the daily temperatures over 86 degrees. Since we have had very few really warm days, it is no wonder that our SDD value for this year is a mere 21 units compared with a long term mean of 78. The featured plot shows the yearly accumulation of SDDs for Ames up until the 19th of August.
Voting:
Good: 25
Bad: 5
Tags: sdd


