IEM Daily Feature
Thursday, 16 May 2024
Thursday, 16 May 2024
Possible 90 Day Departures
Posted: 16 May 2024 05:30 AM
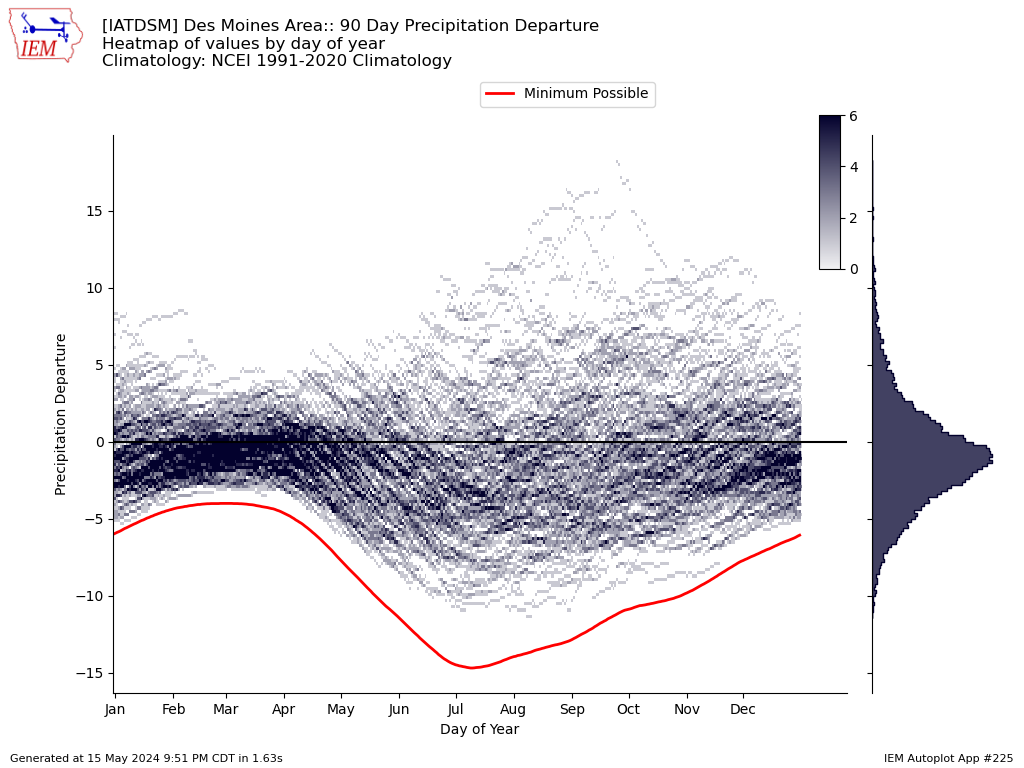
Precipitation departures are an interesting statistic. Unlike temperature departures which tend to have equal magnitude departures possible in both cool and warm directions, negative precipitation departures are bounded by climatology (i.e. you can't have a negative departure). Rewording, if your climatological average precipitation for the month is three inches and you receive zero, the maximum below average departure possible is three inches. The featured chart takes a bit of a deep dive into 90 day trailing precipitation departures by day of the year for Des Moines. The data is presented as a heat map, which represents the number of times (read years) a given departure has happened on the given date. There are many neat aspects found in the chart. The red line represents the maximum negative departure over 90 days when the observed precipitation is zero. Since we get much less precipitation during the cold season, the largest possible negative values are much smaller. And accordingly, the largest observed positive departures are much smaller as well. The right hand histogram shows that most of the distribution is found below 0, which is a sign that the precipitation distribution is skewed and not normally distributed. Another interesting aspect are the downward streaks found during April into the July. These are due to climatology slowly increasing each day, so dry days will more rapidly pull departures more negative than during other times of year.
Voting:
Good = 8
Bad = 0
Tags: precip
Voting:
Good = 8
Bad = 0
Tags: precip

