Past IEM Features tagged: asos
Thunderstorm and Winds
09 Sep 2014 05:05 AMThe Des Moines Airport automated weather station reported a thunderstorm yesterday afternoon along with southeasterly winds. The featured wind rose presents the wind speed and direction during which a thunderstorm is reported within the present weather observation of the site. Thunderstorms are driven by instability in the atmosphere, which is the combination of warm and moist air. Our primary source of that type of air is from the southeast, so it makes sense to see that wind direction dominate the frequency shown in the wind rose. While Iowa gets the warmest air from the southwesterly directions, that air is typically much drier and thus less likely to help promote thunderstorm development. More thunderstorms are expected today.
Voting:
Good: 18
Bad: 10
Abstain: 8
Tags: asos thunder
Hours for Snow
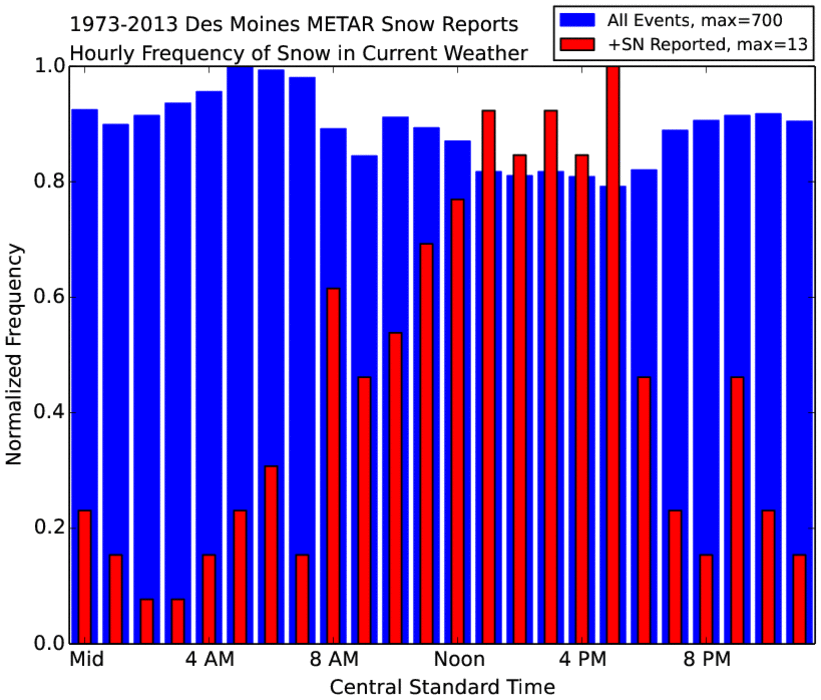
13 Feb 2014 05:47 AMFor rainfall, it is well established that Iowa experiences two peaks in hourly frequency. One is in the early morning hours associated with a phenomena known as the low level jet and the other, in the very late afternoon/evening hours associated with the heating of the day driving storms. For snowfall, the forcing is a bit different and the featured chart presents the hourly frequencies of having snowfall reported by the Des Moines Airport sensor. The peak shown for all events is during the coldest time of day (right before sunrise), which would be the best odds that a precipitating storm could have temperatures cold enough to support snow. That is not the entire story though as the smaller bars depict when the most intense snowfalls are reported (coded +SN in the reports). These intense events have a clear diurnal pattern with the maximum in the late afternoon hours. It is not entirely clear why this is, but a logical explanation is that convective snow (like what we experienced in mid January) is enhanced and perhaps forced by daylight heating. While the bars are normalized, you should notice the large difference in frequency between the intense +SN events and all snow events.
Voting:
Good: 32
Bad: 12
Abstain: 4
Tags: asos snow metar
Dewpoint Depression
22 Aug 2013 05:46 AMYesterday's feature looked at the afternoon dew point being an indicator of the next day's low temperature. The theory being that the air temperature would cool off to the dew point temperature and thus be the low temperature. Today's feature looks at the distribution of dewpoint depression at the time of the daily low temperature for each of the ASOS sites in the state. The dewpoint depression is simply the difference between the air and dewpoint temperature. Differences between sites are likely due to micro-climate effects as each ASOS has different surroundings which include soil types, vegetation, and amount of urban area / concrete around it. The chart shows a large difference between Ames and Des Moines with the median dewpoint depression two degrees less at Ames. The first guess explanation for this difference is the larger urban heat island effect at Des Moines, which would tend to keep the temperature higher and further away from the dewpoint than surrounding locations. Also, the Ames ASOS is located in a topographic depression which would promote cooler temperatures.
Additional plots: same plot for high temperatures, Ames weekly dewpoint depression, and weekly for Des Moines.
Voting:
Good: 123
Bad: 12
Tags: dewpoint asos heatisland


