Past Features
This page lists out the IEM Daily Features for a month at a time. Features have been posted on most days since February 2002. List all feature titles.
Thu Aug 01, 2024
Heat Bursts
01 Aug 2024 05:30 AM
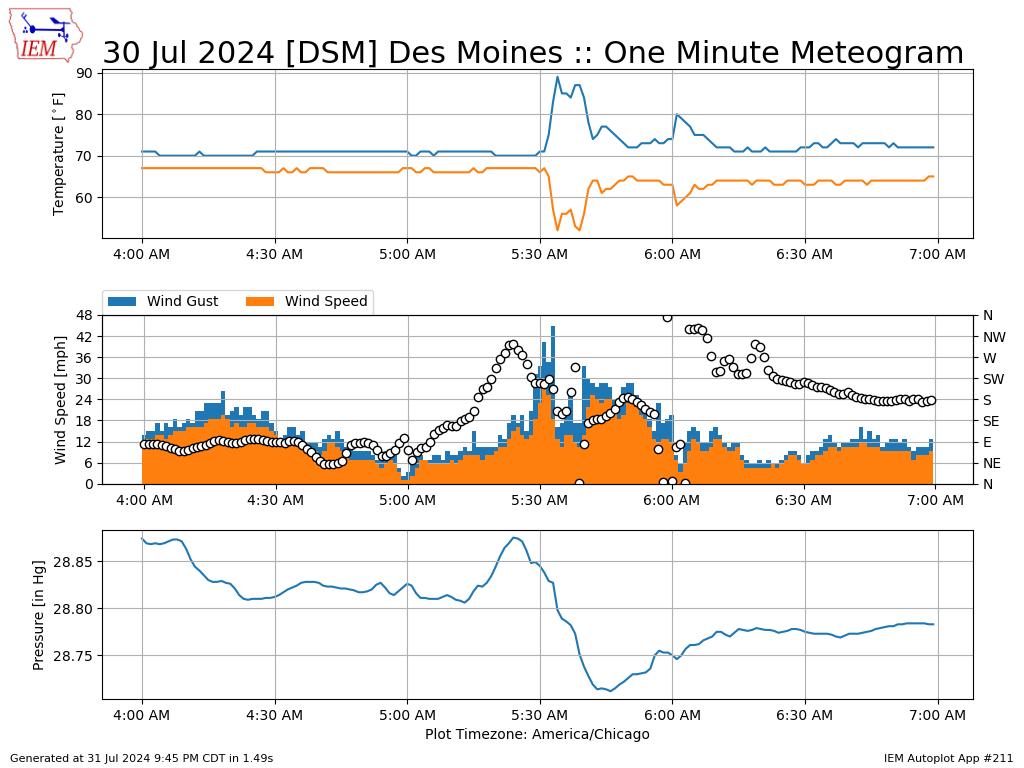
Heat bursts are an interesting and sometimes damaging weather phenomena caused by decaying thunderstorms forcing air to the surface without precipitation. This air warms and dries as it descends. Such an event or maybe even multiple such events were observed by the Des Moines airport early Tuesday morning. The featured chart presents available one minute interval observations of temperature, dew point, wind speed, wind gust, wind direction, and pressure. The classic heat burst signature is shown with the rapid increase in temperature coincident with a rapid decrease in dew point along with a pressure response. The data seems to shown at least two or maybe even three different heat burst events! Fortunately, no known damage reports were associated with this event. Sometimes winds can gust to damaging magnitudes and/or the rapid increase in temperature can damage sensitive plants.
Voting: Good - 10 Bad - 0
Tags: heatburst
Generate This Chart on Website
01 Aug 2024 05:30 AM
Heat bursts are an interesting and sometimes damaging weather phenomena caused by decaying thunderstorms forcing air to the surface without precipitation. This air warms and dries as it descends. Such an event or maybe even multiple such events were observed by the Des Moines airport early Tuesday morning. The featured chart presents available one minute interval observations of temperature, dew point, wind speed, wind gust, wind direction, and pressure. The classic heat burst signature is shown with the rapid increase in temperature coincident with a rapid decrease in dew point along with a pressure response. The data seems to shown at least two or maybe even three different heat burst events! Fortunately, no known damage reports were associated with this event. Sometimes winds can gust to damaging magnitudes and/or the rapid increase in temperature can damage sensitive plants.
Voting: Good - 10 Bad - 0
Tags: heatburst
Generate This Chart on Website
Fri Aug 02, 2024
Top Summer Hourly Precip
02 Aug 2024 05:30 AM
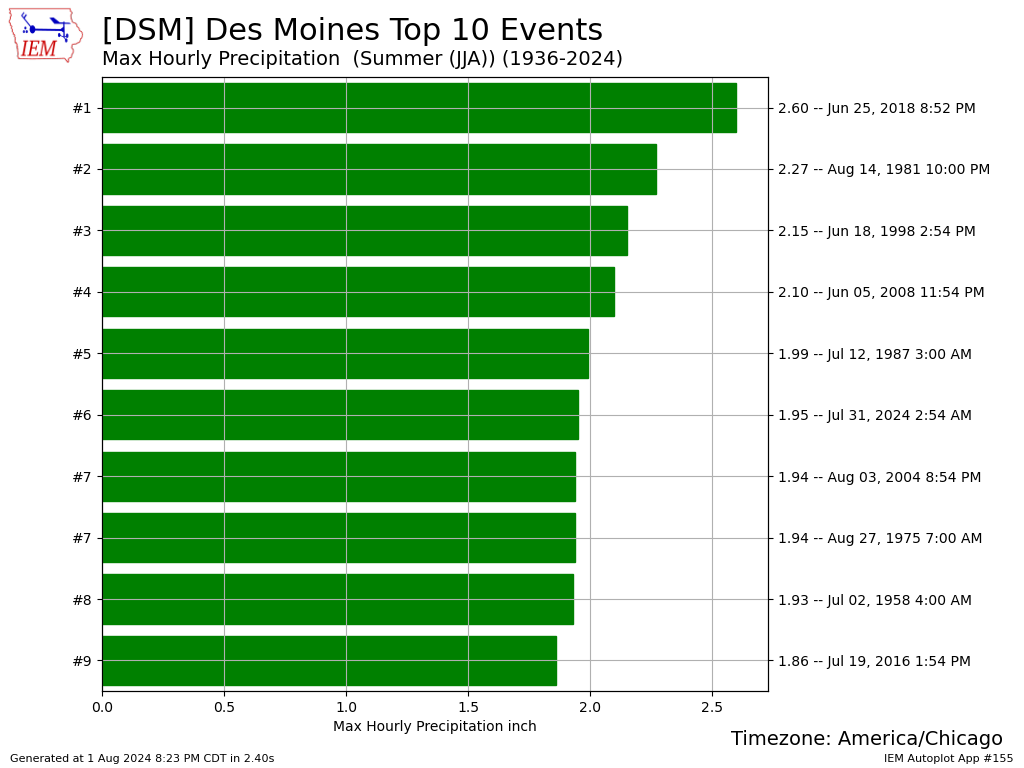
Our recent and numerous rounds of thunderstorms have featured a number of heavy precipitation events. Such is the case this time of year when the lower atmosphere is the warmest and most loaded with water vapor. The featured chart presents the largest hourly precipitation totals for Des Moines during the summer months, based on near top of the hour reports. A total of 1.95 inches early Wednesday morning comes in 6th highest for the site. A major caveat with this type of analysis is that it is based on once per hour reports, so it does not truly capture the largest peak precipitation rates over any 60 minute period.
Voting: Good - 11 Bad - 0
Generate This Chart on Website
02 Aug 2024 05:30 AM
Our recent and numerous rounds of thunderstorms have featured a number of heavy precipitation events. Such is the case this time of year when the lower atmosphere is the warmest and most loaded with water vapor. The featured chart presents the largest hourly precipitation totals for Des Moines during the summer months, based on near top of the hour reports. A total of 1.95 inches early Wednesday morning comes in 6th highest for the site. A major caveat with this type of analysis is that it is based on once per hour reports, so it does not truly capture the largest peak precipitation rates over any 60 minute period.
Voting: Good - 11 Bad - 0
Generate This Chart on Website
Mon Aug 05, 2024
About Average Heat Hours
05 Aug 2024 05:30 AM
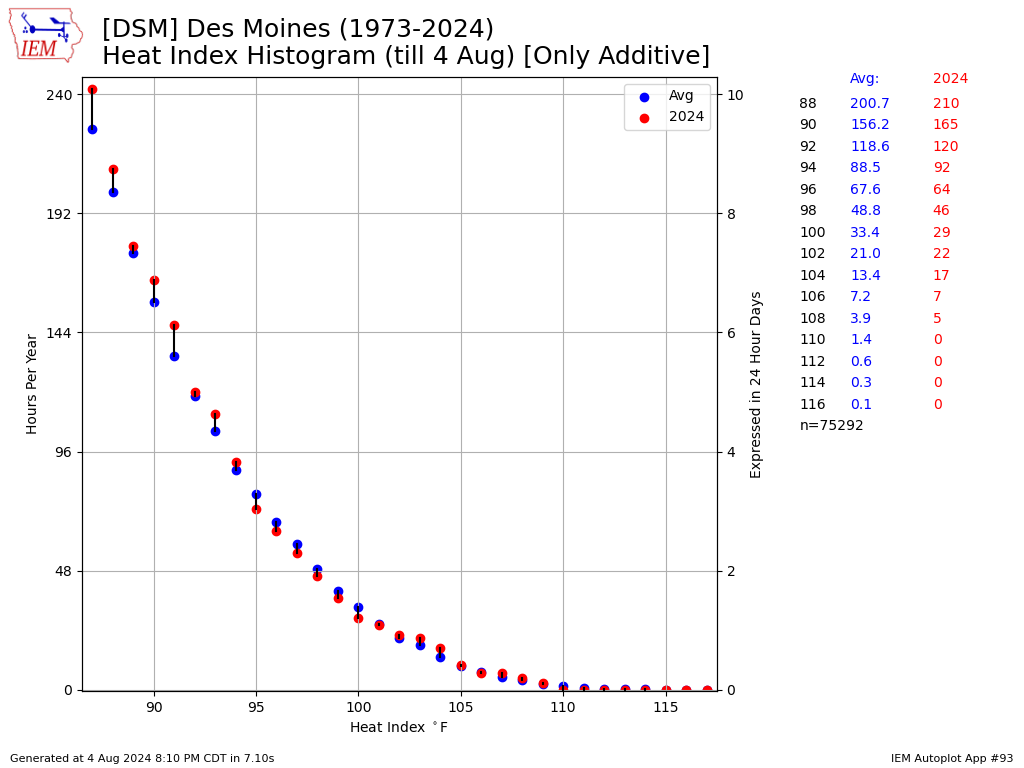
The summer time heat and humidity has been noticeable the past few days and looks to persist into Monday. The featured chart checks in on the number of accumulated hours at or above the given heat index for Des Moines for the season to date period. The 2024 total is plotted along with a simple long term average. There is not much difference to be seen between this two as this season has been about average so far. For those of you wishing for a break from the heat, one does appear to be on the way with very pleasant temperatures arriving on Tuesday and sticking around for a while.
Voting: Good - 9 Bad - 0
Tags: heatindex
Generate This Chart on Website
05 Aug 2024 05:30 AM
The summer time heat and humidity has been noticeable the past few days and looks to persist into Monday. The featured chart checks in on the number of accumulated hours at or above the given heat index for Des Moines for the season to date period. The 2024 total is plotted along with a simple long term average. There is not much difference to be seen between this two as this season has been about average so far. For those of you wishing for a break from the heat, one does appear to be on the way with very pleasant temperatures arriving on Tuesday and sticking around for a while.
Voting: Good - 9 Bad - 0
Tags: heatindex
Generate This Chart on Website
Tue Aug 06, 2024
Close to Average July
06 Aug 2024 05:30 AM
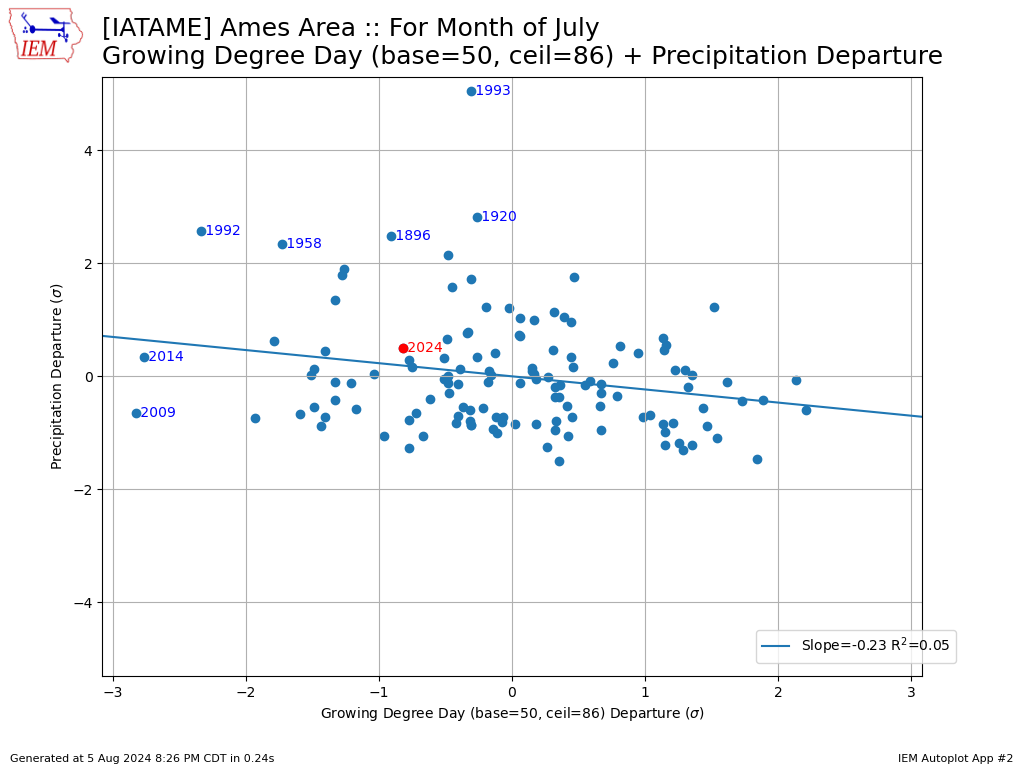
With July in the books, it is a good time to look back on how close to average it was. The featured chart presents July precipitation and Growing Degree Day departures for Ames. The departures are standardized by being presented with units of sigma. This year's value was not too far from average for precipitation and a bit below average for GDDs. Being the warmest month of the year, having a slightly below average GDD accumulation was likely very positive to agricultural crops and certainly was positive to a majority of vegetation that remains quite green going into August.
Voting: Good - 10 Bad - 0
Generate This Chart on Website
06 Aug 2024 05:30 AM
With July in the books, it is a good time to look back on how close to average it was. The featured chart presents July precipitation and Growing Degree Day departures for Ames. The departures are standardized by being presented with units of sigma. This year's value was not too far from average for precipitation and a bit below average for GDDs. Being the warmest month of the year, having a slightly below average GDD accumulation was likely very positive to agricultural crops and certainly was positive to a majority of vegetation that remains quite green going into August.
Voting: Good - 10 Bad - 0
Generate This Chart on Website
Wed Aug 07, 2024
Welcome Temperature Change
07 Aug 2024 05:30 AM
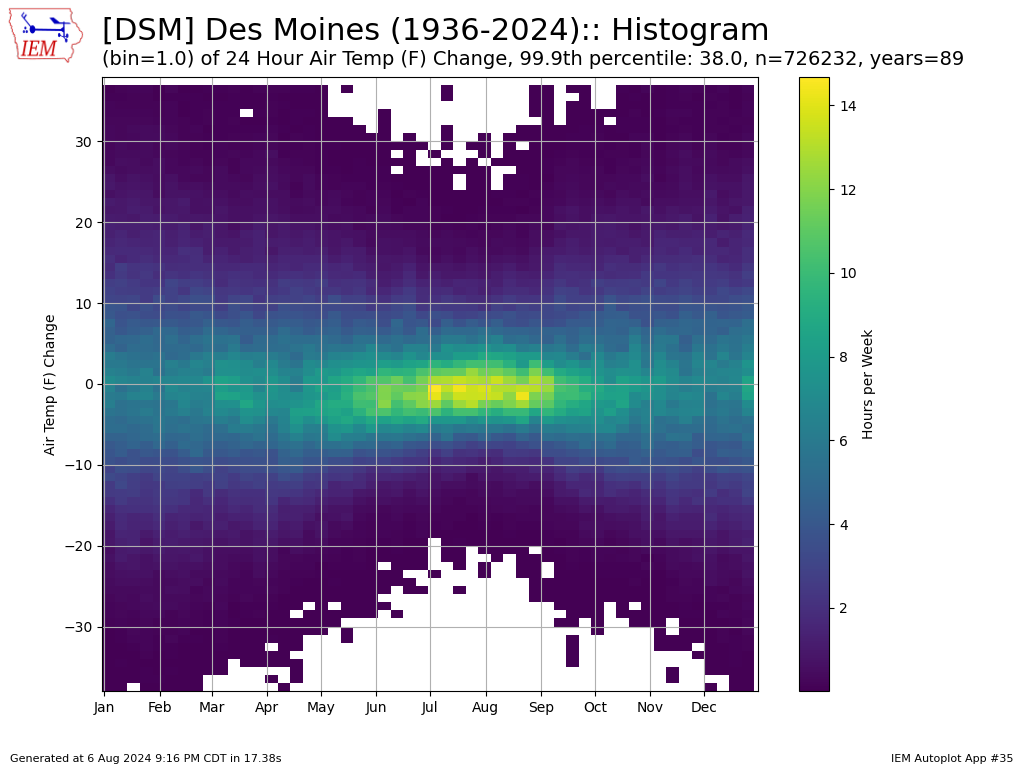
Air temperatures on Tuesday were remarkably different than on Monday with values 20 some degrees Fahrenheit cooler. The featured chart presents a histogram of 24 hour air temperature changes for Des Moines. Values are partitioned by week of the year and over one degree interval changes. The largest frequencies are found close to zero during the heart of the summer season. This is due to the elevated humidity levels and warm soil temperatures acting to buffer any abrupt changes. Values of -20 or more are very limited during the months of July and August, so our change from Monday to Tuesday is a bit rare. This chart also nicely illustrates that persistence is typically a good forecast during the summer months as day to day changes are the smallest.
Voting: Good - 11 Bad - 0
Generate This Chart on Website
07 Aug 2024 05:30 AM
Air temperatures on Tuesday were remarkably different than on Monday with values 20 some degrees Fahrenheit cooler. The featured chart presents a histogram of 24 hour air temperature changes for Des Moines. Values are partitioned by week of the year and over one degree interval changes. The largest frequencies are found close to zero during the heart of the summer season. This is due to the elevated humidity levels and warm soil temperatures acting to buffer any abrupt changes. Values of -20 or more are very limited during the months of July and August, so our change from Monday to Tuesday is a bit rare. This chart also nicely illustrates that persistence is typically a good forecast during the summer months as day to day changes are the smallest.
Voting: Good - 11 Bad - 0
Generate This Chart on Website
Thu Aug 08, 2024
Afternoon 70s
08 Aug 2024 05:30 AM
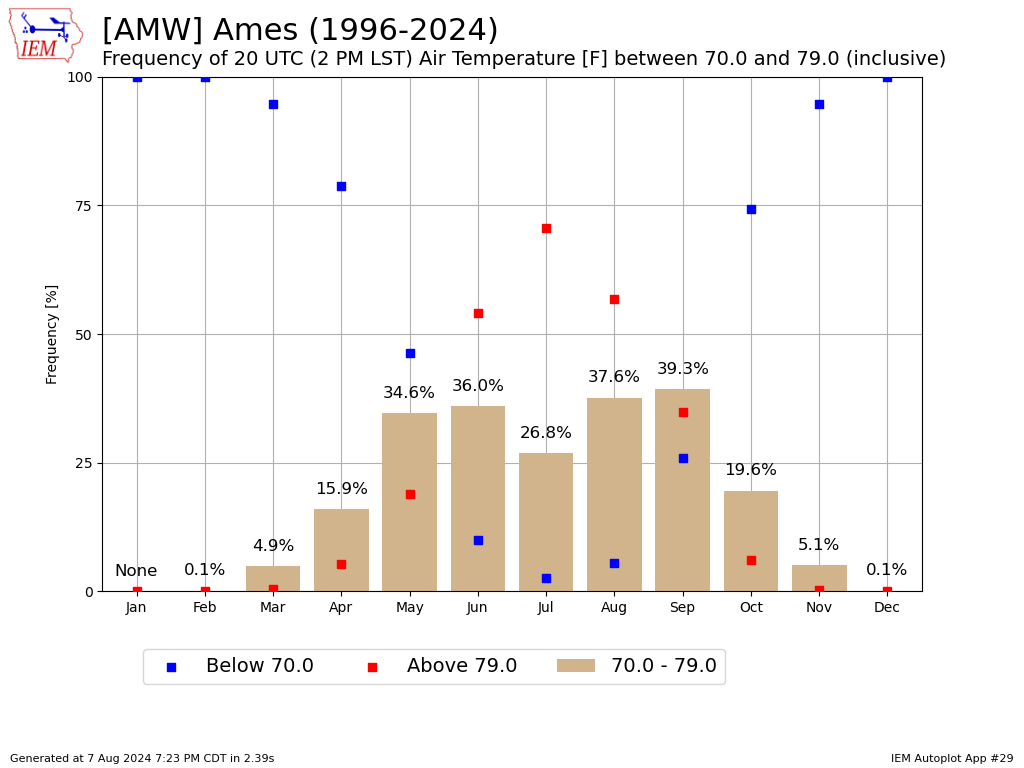
Wednesday was a slightly warmer repeat of Tuesday with very pleasant temperatures and humidity levels. The vast majority of the state was in the 70s at 2 PM and that is the subject of today's featured chart. It presents the monthly frequencies of having an air temperature in the 70s for Ames. The blue dots represent the frequency below 70 and red dot 80 and above. For those that love afternoon temperatures in the 70s, there is certainly plenty of time left to experience those with the highest frequency found during September.
Voting: Good - 7 Bad - 0
Generate This Chart on Website
08 Aug 2024 05:30 AM
Wednesday was a slightly warmer repeat of Tuesday with very pleasant temperatures and humidity levels. The vast majority of the state was in the 70s at 2 PM and that is the subject of today's featured chart. It presents the monthly frequencies of having an air temperature in the 70s for Ames. The blue dots represent the frequency below 70 and red dot 80 and above. For those that love afternoon temperatures in the 70s, there is certainly plenty of time left to experience those with the highest frequency found during September.
Voting: Good - 7 Bad - 0
Generate This Chart on Website
Fri Aug 09, 2024
Recent Blue Days
09 Aug 2024 05:30 AM
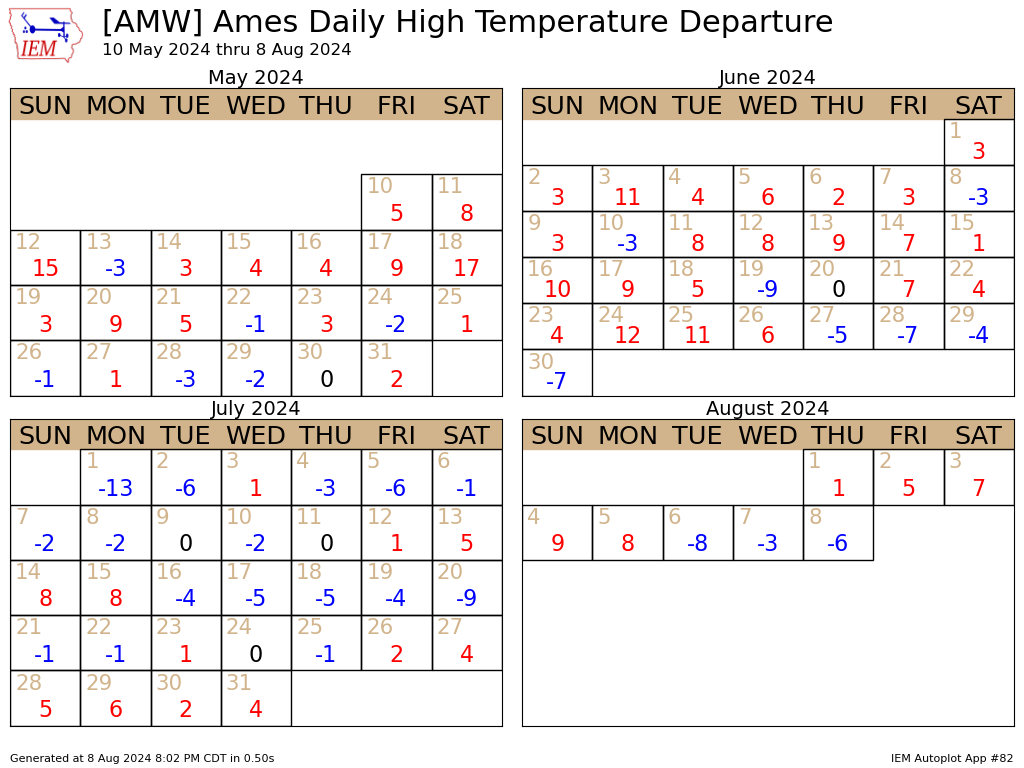
The Iowa State Fair got started on Thursday and it is hard to imagine a better start for weather with very comfortable temperatures and low humidity. After a muggy start to the week, the rest has been very much a treat. The featured chart presents a calendar plot of daily high temperature departures from average for Ames since the first of May. Hot weather has been limited since the end of June. The forecast for the fair next week has slightly warmer temperatures, but nothing of great concern and humidity levels will be within reason. This all should help a record attendance for the fair!
Voting: Good - 7 Bad - 0
Generate This Chart on Website
09 Aug 2024 05:30 AM
The Iowa State Fair got started on Thursday and it is hard to imagine a better start for weather with very comfortable temperatures and low humidity. After a muggy start to the week, the rest has been very much a treat. The featured chart presents a calendar plot of daily high temperature departures from average for Ames since the first of May. Hot weather has been limited since the end of June. The forecast for the fair next week has slightly warmer temperatures, but nothing of great concern and humidity levels will be within reason. This all should help a record attendance for the fair!
Voting: Good - 7 Bad - 0
Generate This Chart on Website
Mon Aug 12, 2024
Chilly August Weekend
12 Aug 2024 05:30 AM
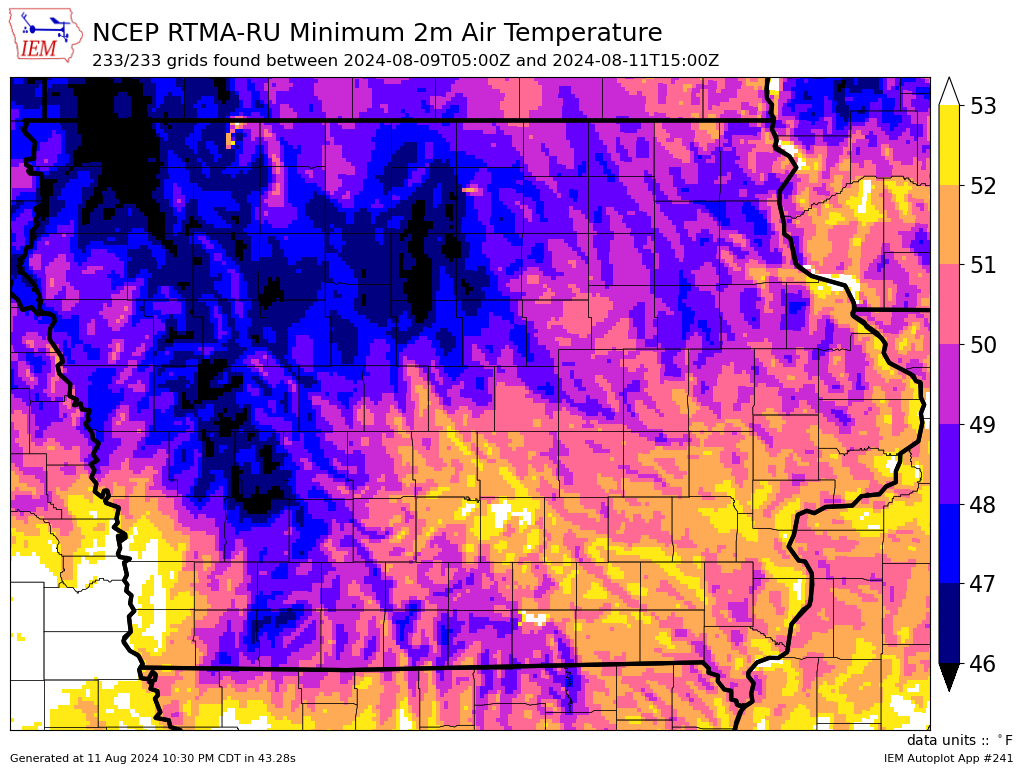
Overnight temperatures over this past weekend were a bit chilly, with some locations in the state dipping below 50°F. Daily record low temperatures were set at Dubuque (48) and Ottumwa (49) along with a few other places. The featured map presents an analysis of coldest temperature on Saturday and Sunday morning based on the NOAA 15-minute RTMA. This product nicely hones in on the subtle river valley topological features over Iowa. It would appear that a number of places reached the mid 40s and a handful of COOP observations seemed to confirm this as well.
Voting: Good - 10 Bad - 0
Generate This Chart on Website
12 Aug 2024 05:30 AM
Overnight temperatures over this past weekend were a bit chilly, with some locations in the state dipping below 50°F. Daily record low temperatures were set at Dubuque (48) and Ottumwa (49) along with a few other places. The featured map presents an analysis of coldest temperature on Saturday and Sunday morning based on the NOAA 15-minute RTMA. This product nicely hones in on the subtle river valley topological features over Iowa. It would appear that a number of places reached the mid 40s and a handful of COOP observations seemed to confirm this as well.
Voting: Good - 10 Bad - 0
Generate This Chart on Website
Tue Aug 13, 2024
Time Yet for 100+
13 Aug 2024 05:46 AM
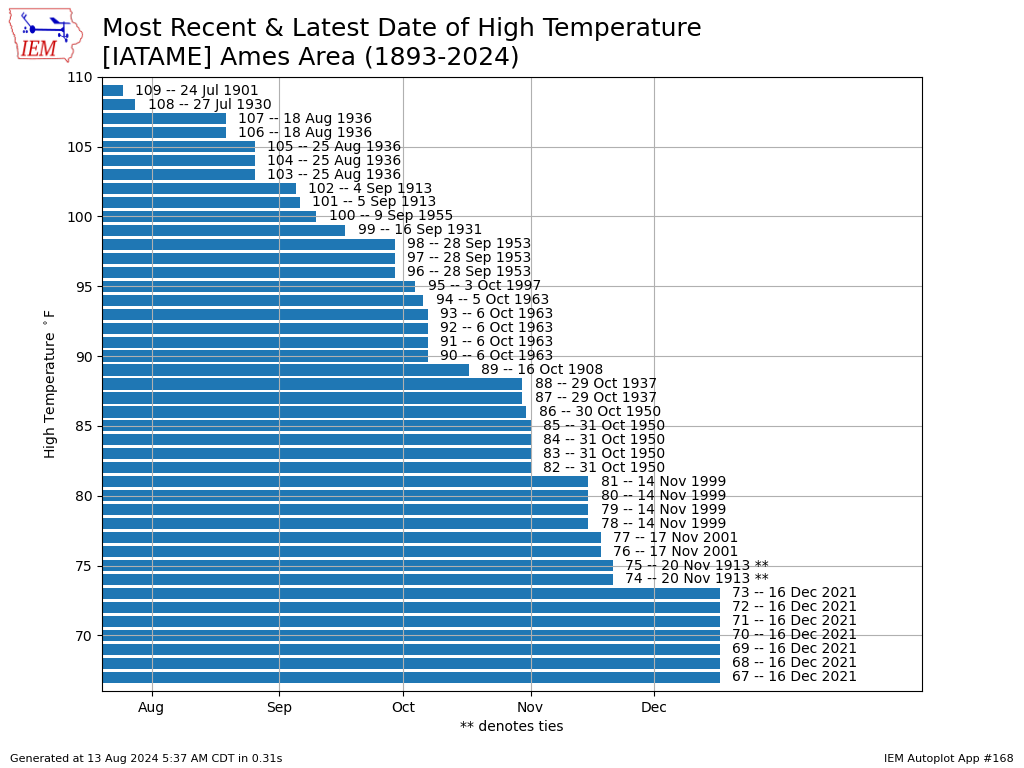
Our current stretch of cool August weather is working on day eight of below average daily high temperatures. The month of September rapidly approaches, so the window of time for the worst of what summer can potentially offer is closing. The featured chart illustrates this by plotting the latest date during the calendar year for a given high temperature threshold. By about the second week of September, temperatures over 100 degrees are outside of climatology and by the second week of October, values over 90 are as well. The forecast continues not to advertise much in the way of significant heat.
Voting: Good - 6 Bad - 0
Generate This Chart on Website
13 Aug 2024 05:46 AM
Our current stretch of cool August weather is working on day eight of below average daily high temperatures. The month of September rapidly approaches, so the window of time for the worst of what summer can potentially offer is closing. The featured chart illustrates this by plotting the latest date during the calendar year for a given high temperature threshold. By about the second week of September, temperatures over 100 degrees are outside of climatology and by the second week of October, values over 90 are as well. The forecast continues not to advertise much in the way of significant heat.
Voting: Good - 6 Bad - 0
Generate This Chart on Website
Wed Aug 14, 2024
August Dew Points
14 Aug 2024 05:30 AM
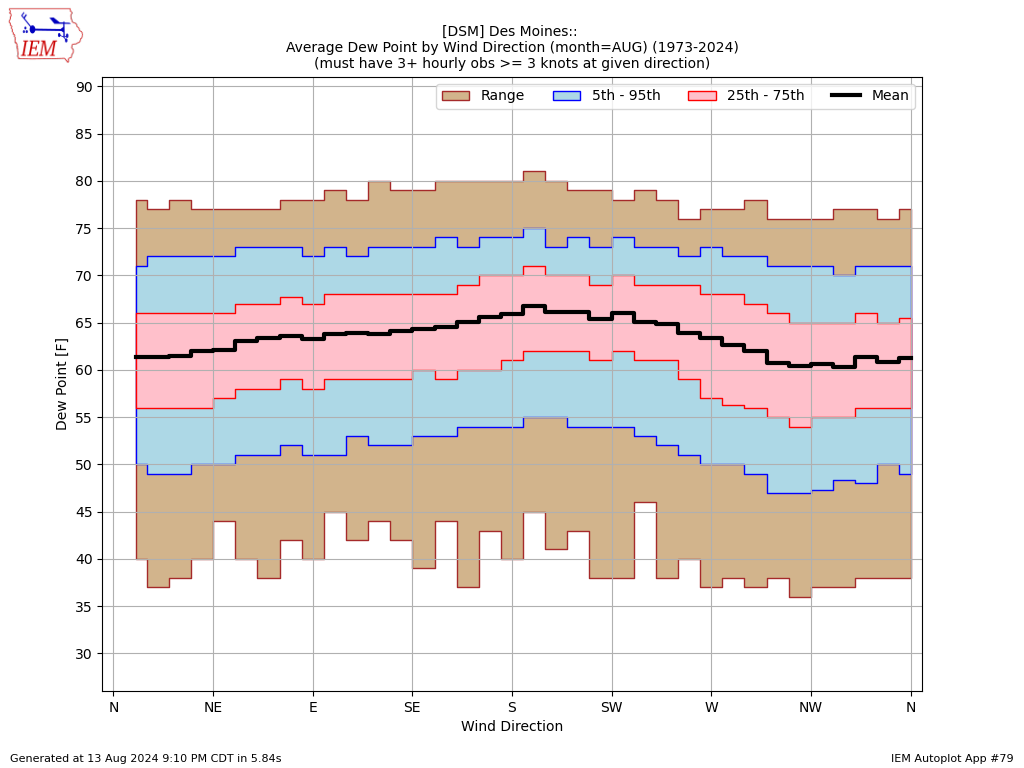
Today's featured chart looks at dew point climatology by wind direction for the month of August for Des Moines. While there is a clean signal shown for a dew point dependence on wind direction, the magnitude of the signal is not that large. Rewording, in Iowa humidity levels during the month of August are generally supported by our transpiring vegetation more so than air mass transport of humidity into the state. Certainly originating from our south and southwest will carry more moisture than that from our northwest, but drier air will also promote more transpiration when there is available soil water, so air mass modification will take place to wash out some of the difference. You can generate this chart for other months of the year and compare the magnitude of the changes.
Voting: Good - 9 Bad - 0
Generate This Chart on Website
14 Aug 2024 05:30 AM
Today's featured chart looks at dew point climatology by wind direction for the month of August for Des Moines. While there is a clean signal shown for a dew point dependence on wind direction, the magnitude of the signal is not that large. Rewording, in Iowa humidity levels during the month of August are generally supported by our transpiring vegetation more so than air mass transport of humidity into the state. Certainly originating from our south and southwest will carry more moisture than that from our northwest, but drier air will also promote more transpiration when there is available soil water, so air mass modification will take place to wash out some of the difference. You can generate this chart for other months of the year and compare the magnitude of the changes.
Voting: Good - 9 Bad - 0
Generate This Chart on Website
Thu Aug 15, 2024
Severe Warnings for Omaha
15 Aug 2024 05:30 AM
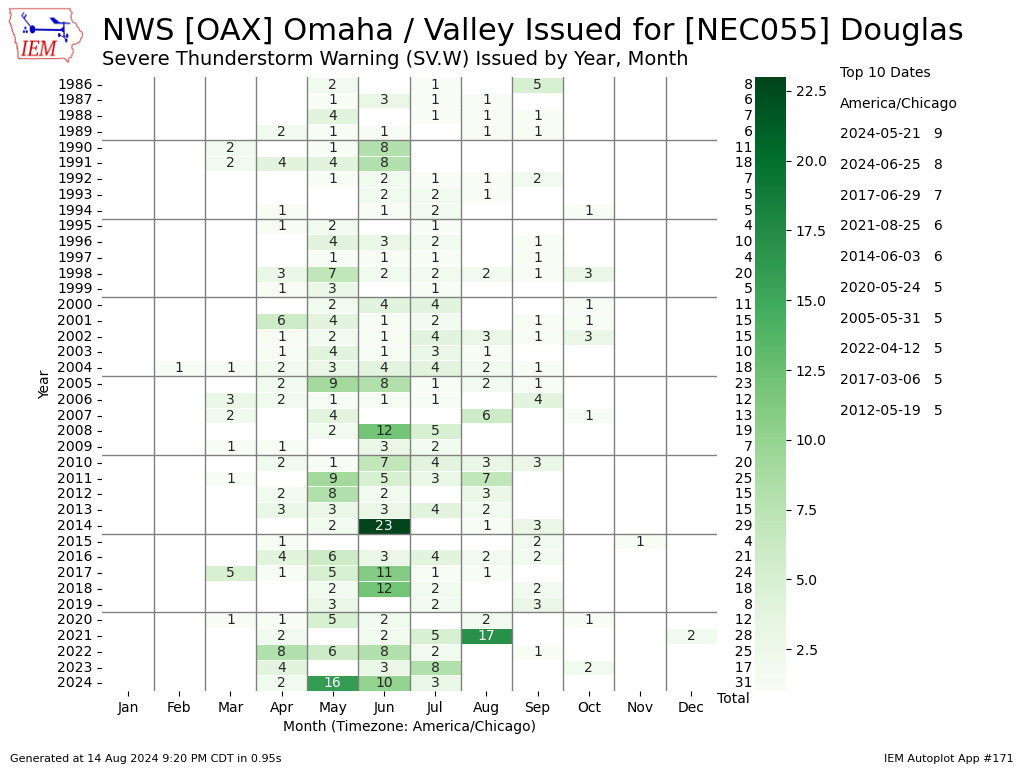
For the Omaha metro, 2024 has been quite the year for severe weather with numerous rounds of tornadoes, damaging wind storms, and hail. The city was again threatened with severe weather on Wednesday, but the strongest storms stayed off to the south and east. The featured chart presents the number of Severe Thunderstorm Warnings issued for Douglas County, Nebraska (Omaha). This accounting is county based, so is a bit nuanced to understand with the present day storm based warning era. That aside, the total this year of 31 is already the largest on record since 1986 using unofficial archives maintained by the IEM. Severe weather is certainly still common during the months of August and September for the area, so the rough stuff may not be over yet for the storm weary folks there.
Voting: Good - 16 Bad - 0
Generate This Chart on Website
15 Aug 2024 05:30 AM
For the Omaha metro, 2024 has been quite the year for severe weather with numerous rounds of tornadoes, damaging wind storms, and hail. The city was again threatened with severe weather on Wednesday, but the strongest storms stayed off to the south and east. The featured chart presents the number of Severe Thunderstorm Warnings issued for Douglas County, Nebraska (Omaha). This accounting is county based, so is a bit nuanced to understand with the present day storm based warning era. That aside, the total this year of 31 is already the largest on record since 1986 using unofficial archives maintained by the IEM. Severe weather is certainly still common during the months of August and September for the area, so the rough stuff may not be over yet for the storm weary folks there.
Voting: Good - 16 Bad - 0
Generate This Chart on Website
Fri Aug 16, 2024
GDD Percent of Average
16 Aug 2024 05:30 AM
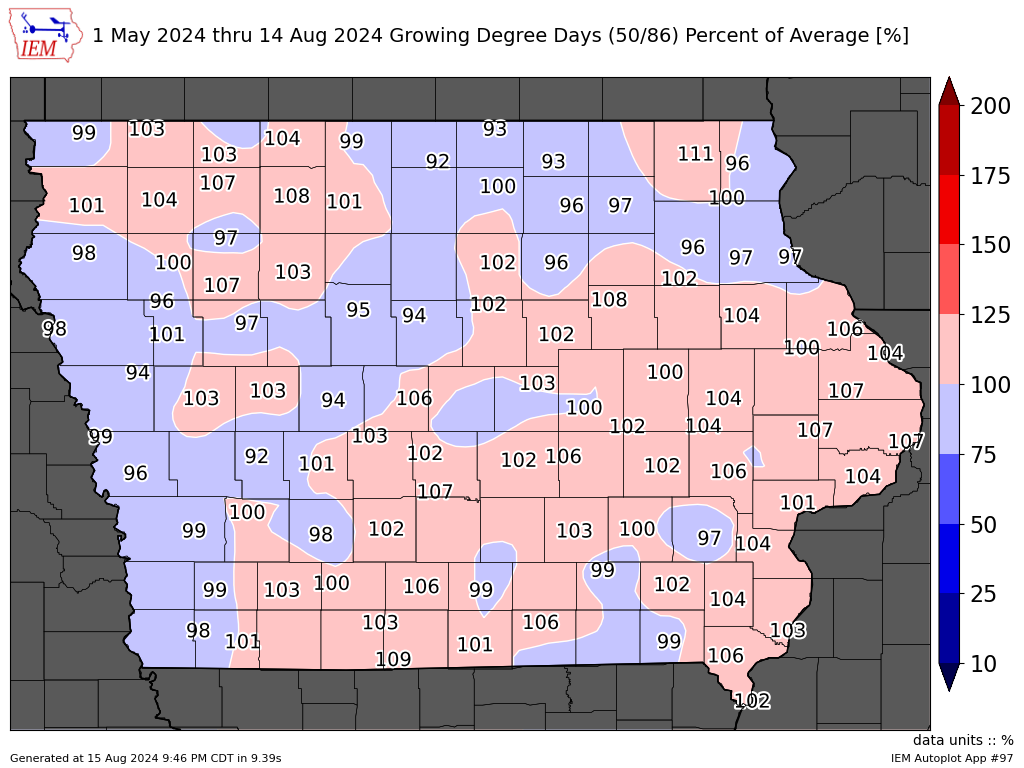
It has been a while since we checked in on Growing Degree Days (GDD), so with our recent stretch of cooler weather it is a good time to see how things look. The featured chart presents the accumulated GDD total since 1 May expressed as a percent of average. Values above 100% would indicate a larger than average accumulation over this period. While precipitation analyses like these tend to be noisy due to localized thunderstorm effects, this plot is a bit noisy as well due to subtle micro-climate issues and varying periods of record for the sites used. It is also somewhat difficult to put a metric like this into context, ie what does a 94% of average total imply. A simple calculation would be to assume we are plotting 100 days worth of data, so a 94 value would imply being an effective six days behind average. Such departures typically do not matter unless there is an early frost and it won't be many more weeks until we can start to worry about such things being possible!
Voting: Good - 10 Bad - 0
Tags: gdd
16 Aug 2024 05:30 AM
It has been a while since we checked in on Growing Degree Days (GDD), so with our recent stretch of cooler weather it is a good time to see how things look. The featured chart presents the accumulated GDD total since 1 May expressed as a percent of average. Values above 100% would indicate a larger than average accumulation over this period. While precipitation analyses like these tend to be noisy due to localized thunderstorm effects, this plot is a bit noisy as well due to subtle micro-climate issues and varying periods of record for the sites used. It is also somewhat difficult to put a metric like this into context, ie what does a 94% of average total imply. A simple calculation would be to assume we are plotting 100 days worth of data, so a 94 value would imply being an effective six days behind average. Such departures typically do not matter unless there is an early frost and it won't be many more weeks until we can start to worry about such things being possible!
Voting: Good - 10 Bad - 0
Tags: gdd
Mon Aug 19, 2024
Annual Wind Speed Minimum
19 Aug 2024 05:30 AM
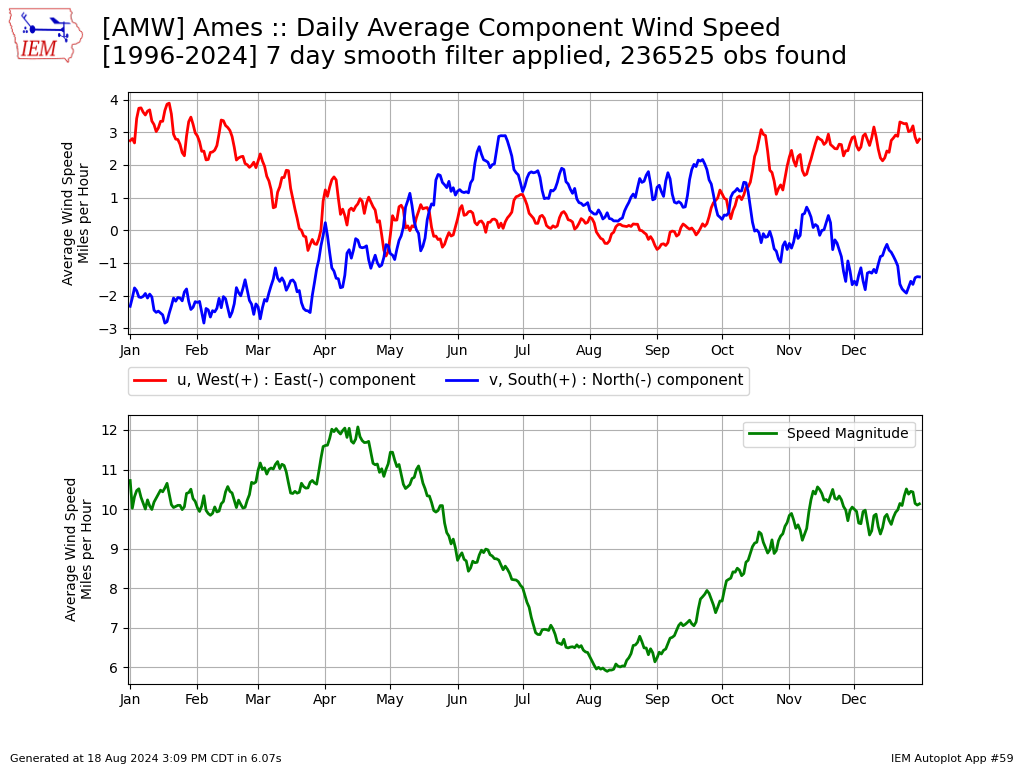
Wind speeds were rather light on Sunday, which is about what is expected for the middle of August. The featured chart presents the wind speed climatology by day of the year for Ames based on period of record observations. The top panel breaks the wind direction and speed into components. The meteorological convention is to call these "u" and "v" wind speeds with "u" representing west to east motion and "v" representing south to north motion. So a given wind speed and direction can be expressed as component u and v speeds. This makes for an informative climatology as these values have intuitive implicates for the source of air masses being advected into the state. For example, the largest negative "v" values are found during the winter months and these would represent the dominance of northerly winds during the cold months. The bottom panel is a simple and smoothed average of the overall wind speed with the annual minimum found during the first half of August.
Voting: Good - 8 Bad - 0
Tags: wind
Generate This Chart on Website
19 Aug 2024 05:30 AM
Wind speeds were rather light on Sunday, which is about what is expected for the middle of August. The featured chart presents the wind speed climatology by day of the year for Ames based on period of record observations. The top panel breaks the wind direction and speed into components. The meteorological convention is to call these "u" and "v" wind speeds with "u" representing west to east motion and "v" representing south to north motion. So a given wind speed and direction can be expressed as component u and v speeds. This makes for an informative climatology as these values have intuitive implicates for the source of air masses being advected into the state. For example, the largest negative "v" values are found during the winter months and these would represent the dominance of northerly winds during the cold months. The bottom panel is a simple and smoothed average of the overall wind speed with the annual minimum found during the first half of August.
Voting: Good - 8 Bad - 0
Tags: wind
Generate This Chart on Website
Tue Aug 20, 2024
Wonderful Fair Weather
20 Aug 2024 05:30 AM
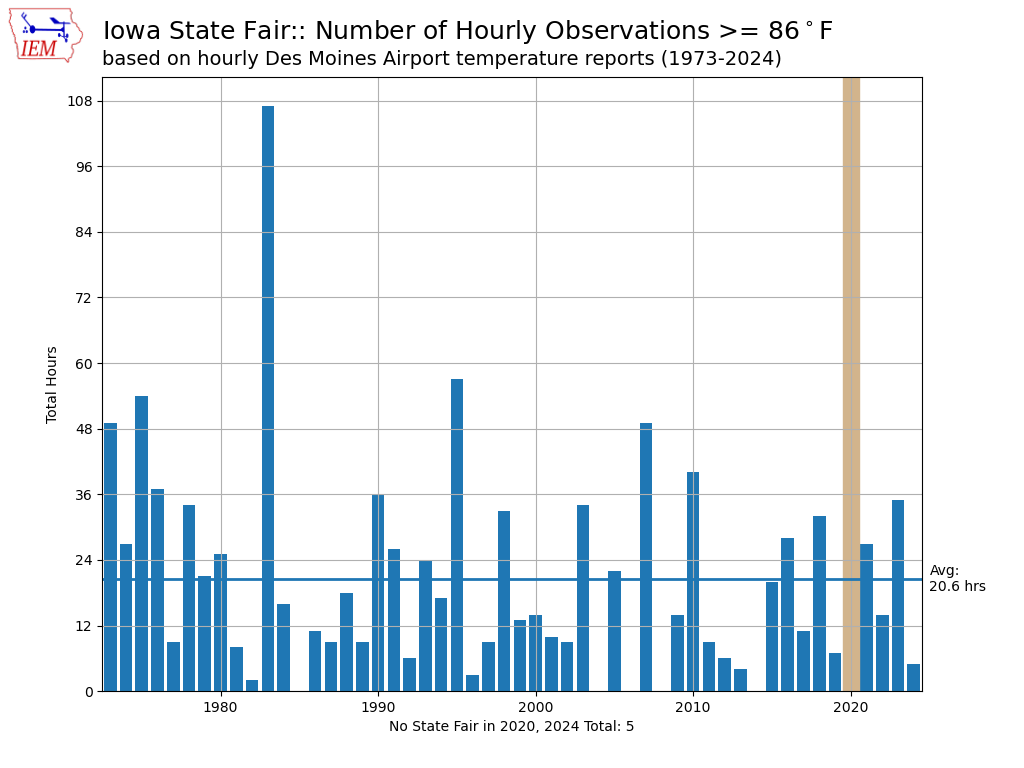
The Iowa State Fair ended on Sunday with a record attendance of just under 1.2 million people over the ten day event. The weather certainly was very nice for most of the event and contributed to the record. The featured chart uses the Des Moines airport hourly temperature observations to estimate the number of hours with an air temperature of at least 86 degrees. The 2024 total of just five hours is well below the simple long term average of 21 and the lowest total since 2014.
Voting: Good - 10 Bad - 0
Tags: statefair
20 Aug 2024 05:30 AM
The Iowa State Fair ended on Sunday with a record attendance of just under 1.2 million people over the ten day event. The weather certainly was very nice for most of the event and contributed to the record. The featured chart uses the Des Moines airport hourly temperature observations to estimate the number of hours with an air temperature of at least 86 degrees. The 2024 total of just five hours is well below the simple long term average of 21 and the lowest total since 2014.
Voting: Good - 10 Bad - 0
Tags: statefair
Wed Aug 21, 2024
SDD Ranks
21 Aug 2024 05:30 AM
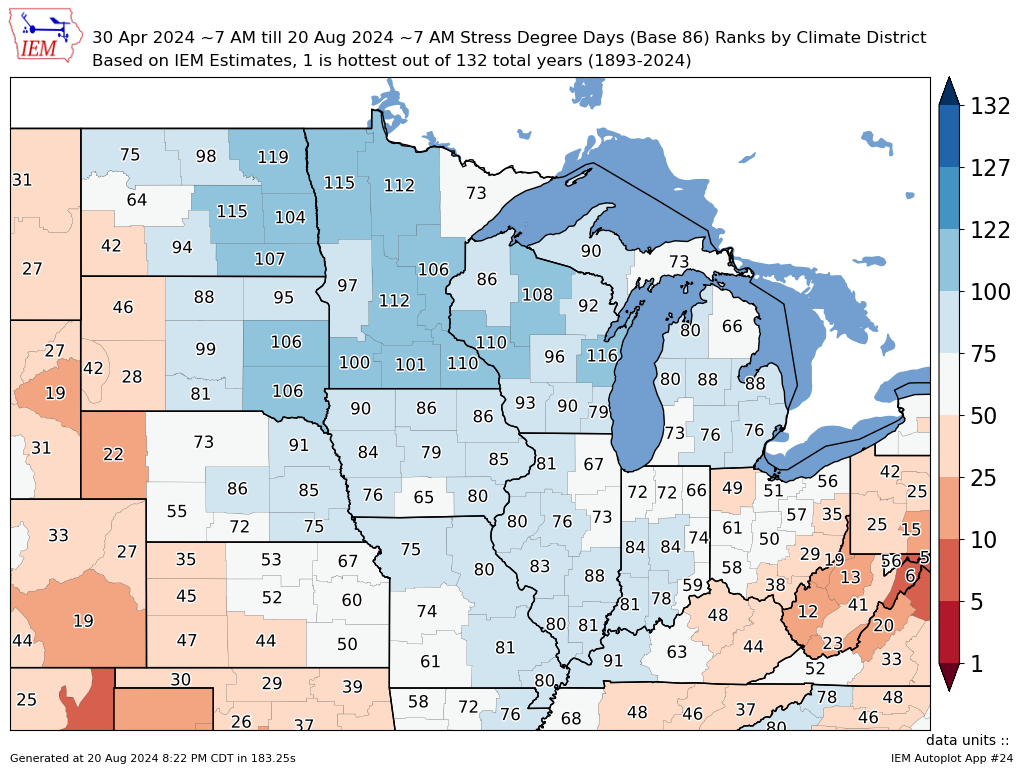
While we have seen brief periods with very hot weather, much of this summer has been quite comfortable with yesterday being another such day with highs generally in the 70s. One quantitative measure of how much hot weather there has been can be found with Stress Degree Days (SDD)s. The common equation to compute this value is to sum the difference from 86°F any days with a high above above that threshold. For example, a day with a high of 88°F would accumulate two units whereas a day with a high of 78°F would accumulate zero. The featured chart computes ranks for accumulated SDDs by climate district for the summer to date. A rank of one would indicate the largest SDD accumulation on record being this year and a rank of 132 being the smallest since 1893. The map of unofficial IEM estimates indicates very little SDD concerns over nearly all of the corn belt with values just or well below average.
Voting: Good - 14 Bad - 0
Tags: sdd
Generate This Chart on Website
21 Aug 2024 05:30 AM
While we have seen brief periods with very hot weather, much of this summer has been quite comfortable with yesterday being another such day with highs generally in the 70s. One quantitative measure of how much hot weather there has been can be found with Stress Degree Days (SDD)s. The common equation to compute this value is to sum the difference from 86°F any days with a high above above that threshold. For example, a day with a high of 88°F would accumulate two units whereas a day with a high of 78°F would accumulate zero. The featured chart computes ranks for accumulated SDDs by climate district for the summer to date. A rank of one would indicate the largest SDD accumulation on record being this year and a rank of 132 being the smallest since 1893. The map of unofficial IEM estimates indicates very little SDD concerns over nearly all of the corn belt with values just or well below average.
Voting: Good - 14 Bad - 0
Tags: sdd
Generate This Chart on Website
Thu Aug 22, 2024
Could it be Fall?
22 Aug 2024 05:30 AM
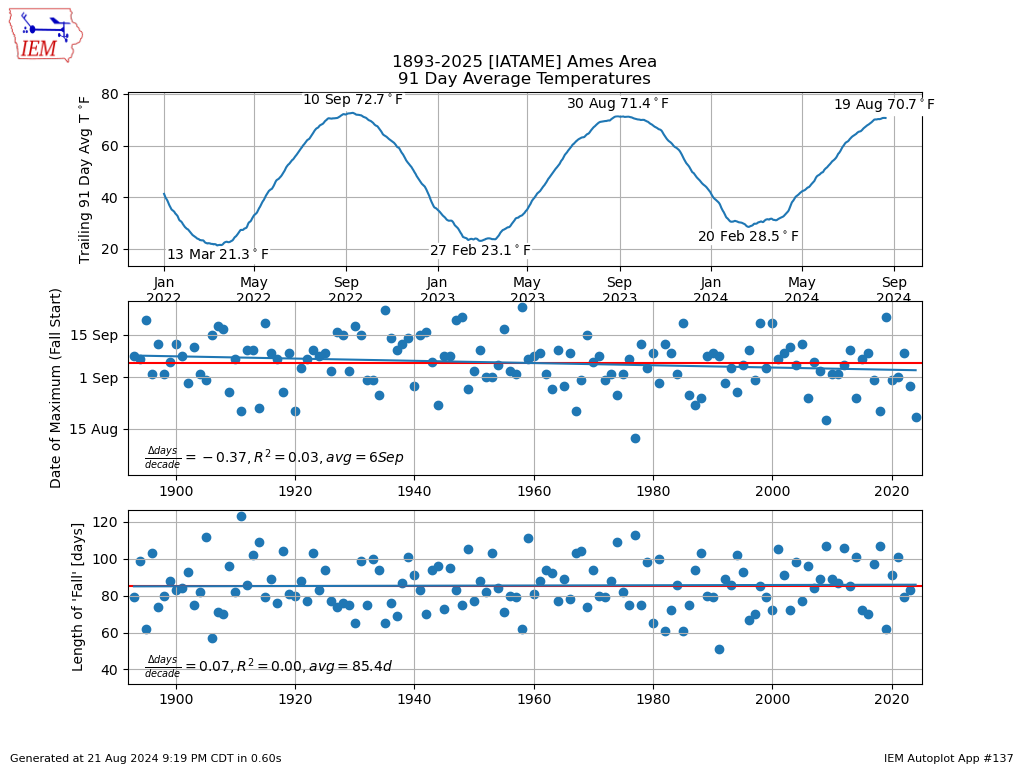
The signs of fall are all around us this week with school starting up, football just around the corner, and some fall like temperatures this week. The actual start of the fall season is subjective to most folks, but if one considers the end of the warmest consecutive 91 day period as the summer season, then perhaps is already here, for at least Ames! The featured chart presents trailing 91 day average temperatures with the maximum and minimum values each year labelled. The plot indicates that Monday was the end of such a period with the temperatures on Tuesday pulling down the average enough to drop the value just slightly below. We are playing a bit of an arithmetic game here, so we need to look back 91 days ago to see what temperatures our current temperatures are replacing with the window average. So for around the 22nd of May, we find daily temperatures just slightly warmer and not much in the way of warmer temperatures to end May. Rewording, it would seem with hotter temperatures forecast next week, our 91 day average will again be on the upswing and we would not longer have a terminus to such a period (so summer continues). The middle panel of the featured plot would indicates that climatology says an end of summer at this time of August is a bit rare with about two more weeks to go before an average date is reached.
Voting: Good - 7 Bad - 0
Generate This Chart on Website
22 Aug 2024 05:30 AM
The signs of fall are all around us this week with school starting up, football just around the corner, and some fall like temperatures this week. The actual start of the fall season is subjective to most folks, but if one considers the end of the warmest consecutive 91 day period as the summer season, then perhaps is already here, for at least Ames! The featured chart presents trailing 91 day average temperatures with the maximum and minimum values each year labelled. The plot indicates that Monday was the end of such a period with the temperatures on Tuesday pulling down the average enough to drop the value just slightly below. We are playing a bit of an arithmetic game here, so we need to look back 91 days ago to see what temperatures our current temperatures are replacing with the window average. So for around the 22nd of May, we find daily temperatures just slightly warmer and not much in the way of warmer temperatures to end May. Rewording, it would seem with hotter temperatures forecast next week, our 91 day average will again be on the upswing and we would not longer have a terminus to such a period (so summer continues). The middle panel of the featured plot would indicates that climatology says an end of summer at this time of August is a bit rare with about two more weeks to go before an average date is reached.
Voting: Good - 7 Bad - 0
Generate This Chart on Website
Fri Aug 23, 2024
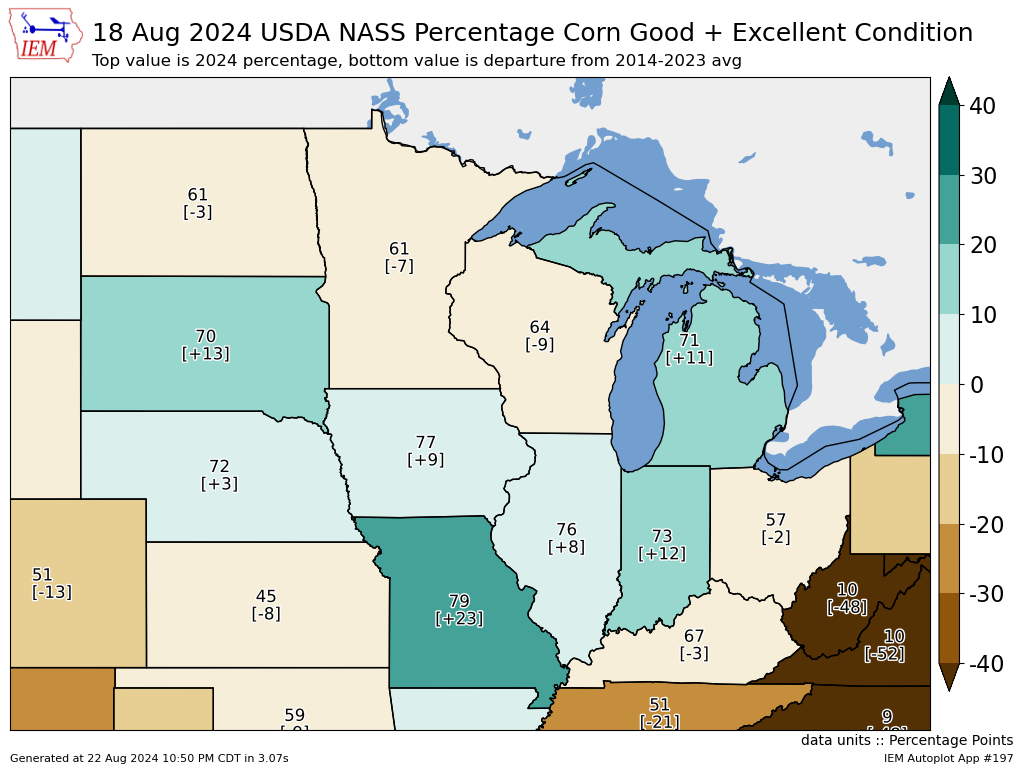
Good + Excellent Corn
23 Aug 2024 05:30 AM
The corn and soybean crops this year continue to look in great shape thanks to sufficient rain and limited hot weather. The featured map presents recent USDA NASS estimated percentage of corn crop acres currently in good or excellent condition. The values are color coded by departure from a recent ten year average approximately valid for this day of the year. Much of the corn belt is shown in great shape and much of the potential yield is already on board as corn reaches maturity. Soybeans could certainly still use more rain to support yields and even corn to help improve grain quality. August does look to end on a hot note, so more rain would certainly help reduce late season water stress.
Voting: Good - 12 Bad - 0
Tags: nass corn 2024
Generate This Chart on Website
Mon Aug 26, 2024
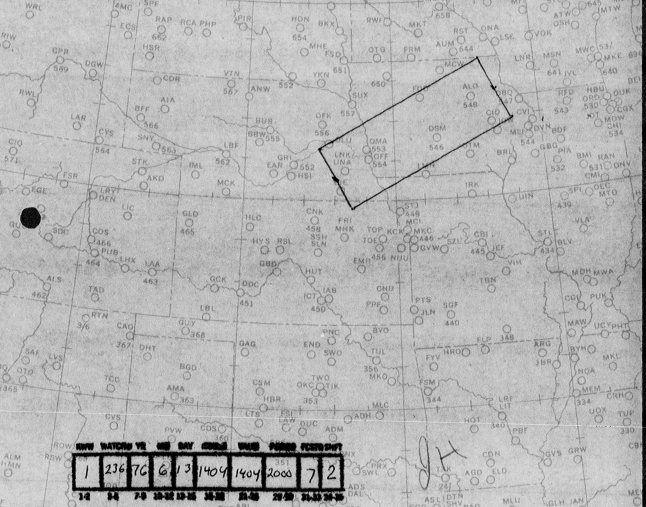
Weather Archaeology
26 Aug 2024 05:30 AM
The IEM website's primary goal is to make archives of weather and climate data openly and easily accessible. Besides this website, a few others at Iowa State University are curated to support this effort. One of these includes MTArchive, which contains a number of meteorological domain specific data formats and general archives. Today's featured graphic highlights a new and very exciting archive that was added to MTArchive over the weekend. The National Severe Storms Forecast Center (NSSFC), generally and currently known as the Storm Prediction Center (SPC), had a microfilm archive of many of its products between the 1950s and 1980s. SPC worked to digitize these archives and the raw digitization can be found on the MTArchive website here. This information is hot off the presses, so the archive is not very user friendly yet to find specific products from specific dates. The hope is that this dataset will get curated over the coming months, with more useful products added to MTArchive and the IEM NWS Text Archives. The featured image is the watch that was issued about an hour prior to the Jordan, IA F5 tornado on 13 June 1976!
Voting: Good - 18 Bad - 0
Tue Aug 27, 2024
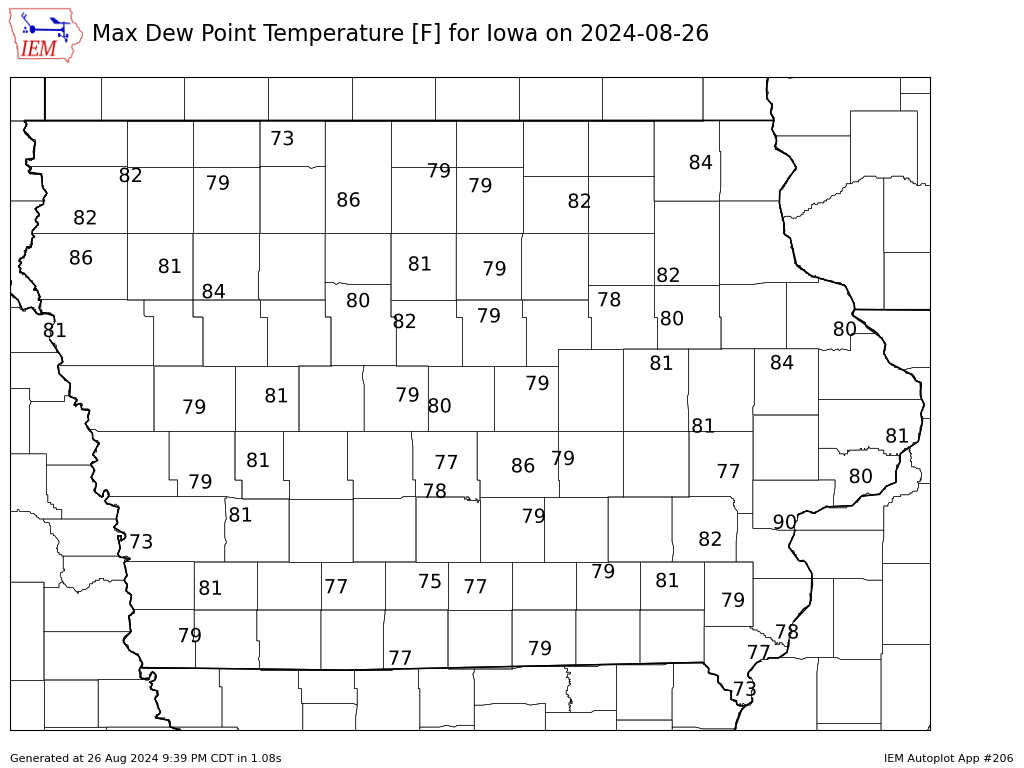
Ugly Dew Points
27 Aug 2024 05:30 AM
The hottest day of the year waited all summer until the start of school to occur. The entire state was covered by an Excessive Heat Warning due to heat index values pushing 110°F and higher. Dew point readings were ugly with values in the upper 70s and lower 80s. The featured chart presents the maximum reported dew point temperature on Monday from the airport weather stations. A 90°F value is shown in southeastern Iowa and is certainly an invalid observation. 80°F dew points happen a couple of times per year, but this event was combined with air temperatures in the upper 90s, which made for very dangerous conditions.
Voting: Good - 11 Bad - 0
Generate This Chart on Website
Wed Aug 28, 2024
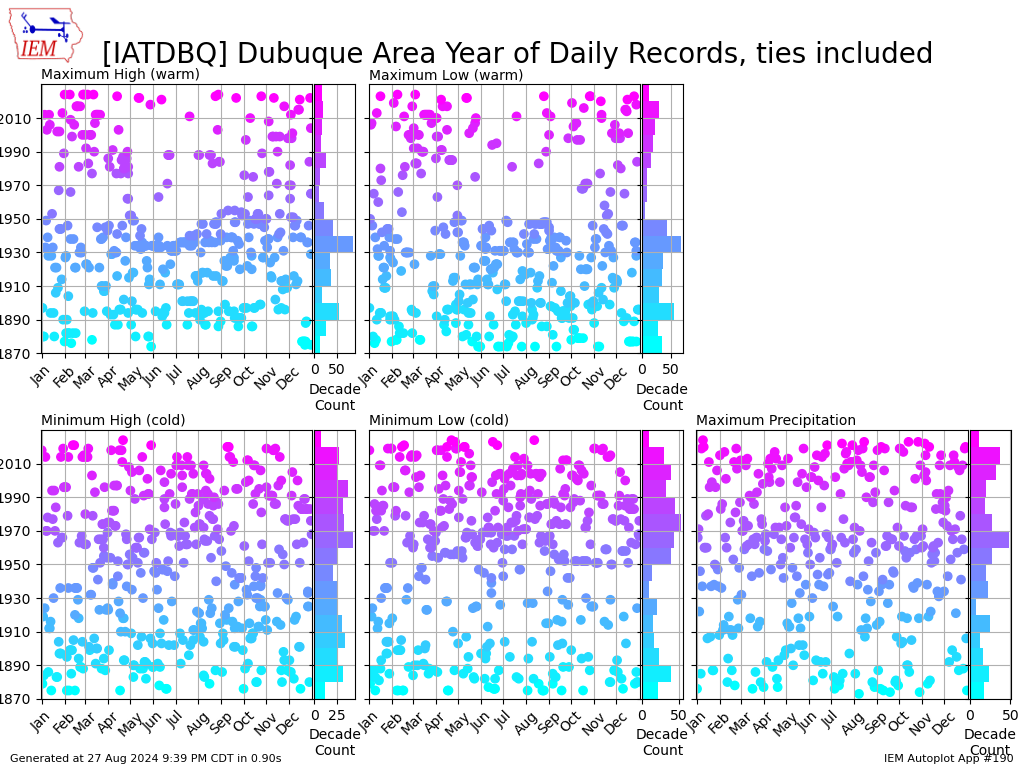
Tying 129 year old record
28 Aug 2024 05:30 AM
The really hot and muggy air over all of the state on Monday was relegated to eastern Iowa on Tuesday with a number of locations there setting or tying daily high temperature records. One such location was Dubuque, with a high temperature of 94°F tying a record set way back in 1895! The featured chart looks into where the present day records lie for Dubuque. The dots represent the year and day of the year combination where the present day records reside. They are colored and counted by decade with the side bar chart for each record type. There are still plenty of records that exist still for the decades even before the 1890s! For each record type, it is interesting to denote any decal trends and even seasonal. For example, for the top two panels, there are very few summer season records being set since about 1950.
Voting: Good - 11 Bad - 0
Generate This Chart on Website
Thu Aug 29, 2024
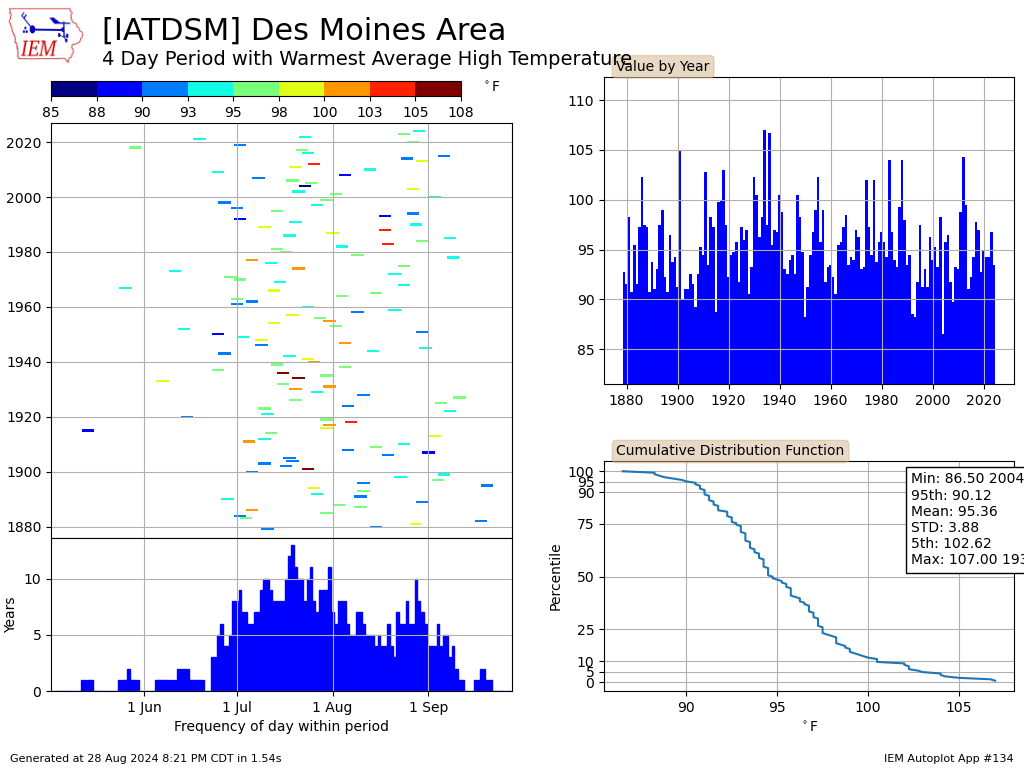
Warmest Four Day Stretch
29 Aug 2024 05:30 AM
Temperatures were again quite warm on Wednesday making for the fourth such day in a row this week. For an average high temperature over four days, this recent stretch was the warmest for the year for most sites in the state. The featured chart presents the warmest four day period each year for Des Moines based on average high temperature. The top left panel shows the period and value each year. The bottom left panel plots the day of year frequency for participating within such a period and the right two panels present the values in a couple of different ways. Having such a period happen during the end of August is certainly not that rare and in fact, is found squarely within a secondary maximum of frequency for the year. The reason for this secondary maximum likely has to do with the juxtaposition of a period that can easily still experience hot temperatures along with strong solar heating and a small cessation in humidity that can allow further heating. This recent period featured high humidity levels as well, so the aforementioned decrease does not appear to be a requirement.
Voting: Good - 10 Bad - 0
Generate This Chart on Website
Fri Aug 30, 2024
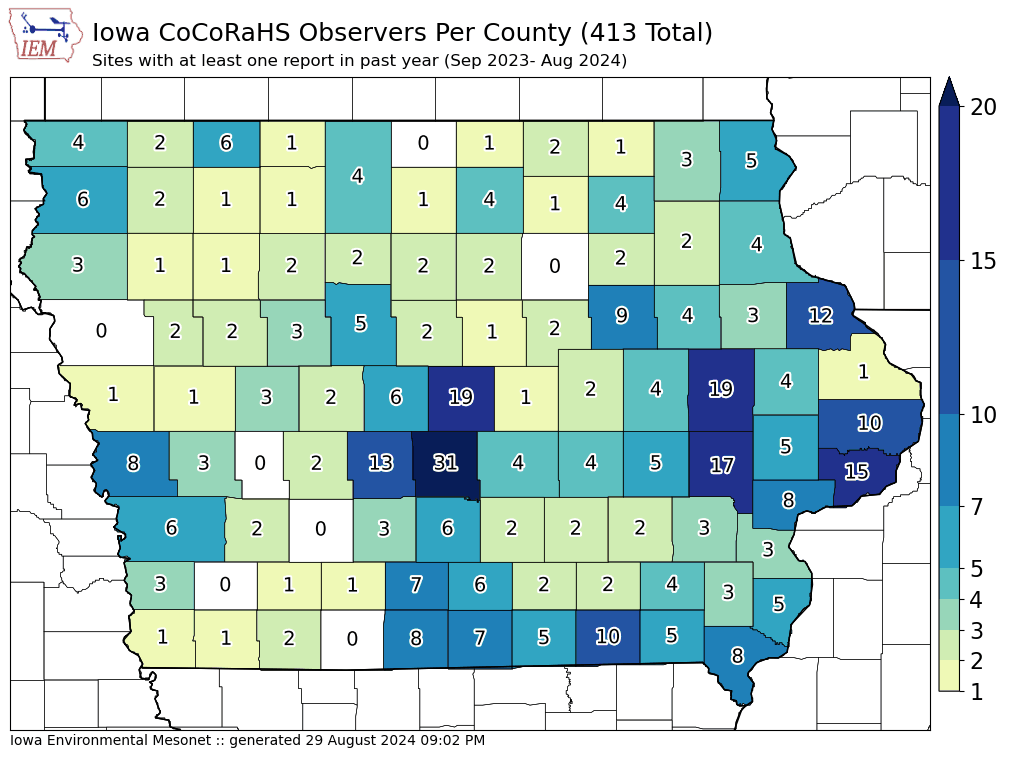
Consider Joining CoCoRaHS
30 Aug 2024 05:30 AM
CoCoRaHS has one of the more interesting acronyms you will see. It stands for Community Collaborative Rain, Hail and Snow network. It is a citizen science project that supports the daily measurement of rain, hail, and snow. The featured chart presents the current number of observers per county with at least one report over the past year. It would certainly be nice to have an active reporter in all 99 counties of Iowa and more reports in general! The CoCoRaHS has full details on the project and links to a standardized rain gauge they recommend to measure rain and snow. The website has a number of tools and it is fun to compare your collected reports with your neighbors! Please consider joining the effort.
Voting: Good - 21 Bad - 1
Tags: cocorahs