IEM Daily Feature
Friday, 16 August 2024
Friday, 16 August 2024
GDD Percent of Average
Posted: 16 Aug 2024 05:30 AM
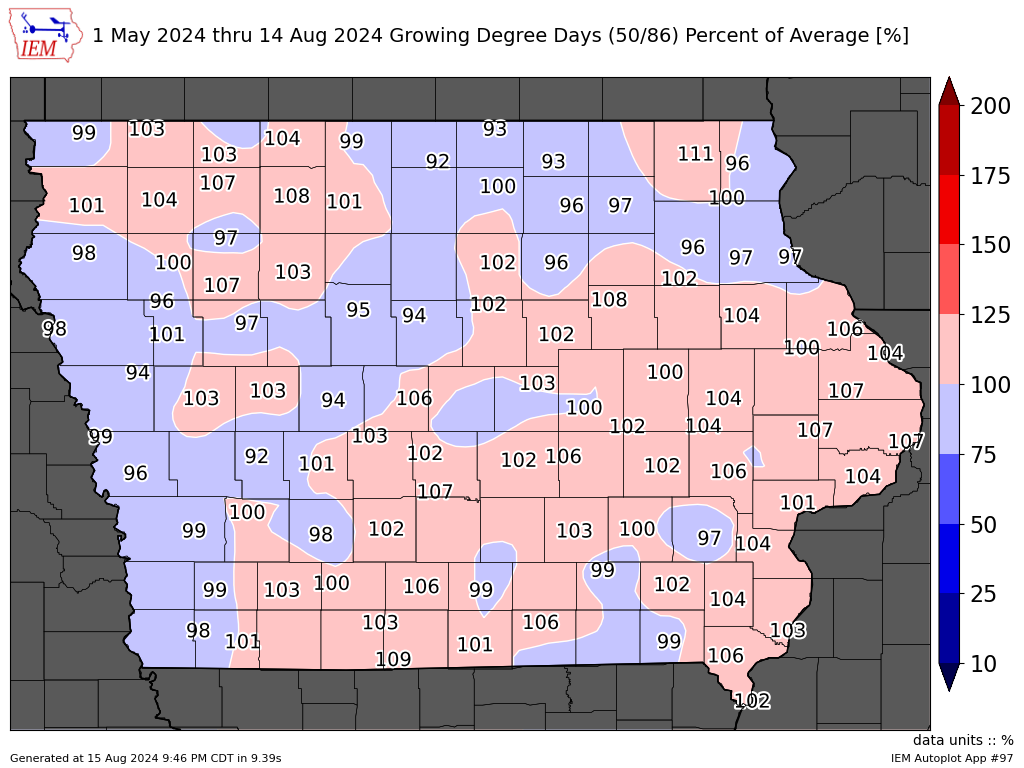
It has been a while since we checked in on Growing Degree Days (GDD), so with our recent stretch of cooler weather it is a good time to see how things look. The featured chart presents the accumulated GDD total since 1 May expressed as a percent of average. Values above 100% would indicate a larger than average accumulation over this period. While precipitation analyses like these tend to be noisy due to localized thunderstorm effects, this plot is a bit noisy as well due to subtle micro-climate issues and varying periods of record for the sites used. It is also somewhat difficult to put a metric like this into context, ie what does a 94% of average total imply. A simple calculation would be to assume we are plotting 100 days worth of data, so a 94 value would imply being an effective six days behind average. Such departures typically do not matter unless there is an early frost and it won't be many more weeks until we can start to worry about such things being possible!
Voting:
Good = 10
Bad = 0
Tags: gdd
Voting:
Good = 10
Bad = 0
Tags: gdd