IEM Daily Feature
Friday, 13 September 2013
Friday, 13 September 2013
Drought Hole
Posted: 13 Sep 2013 05:44 AM
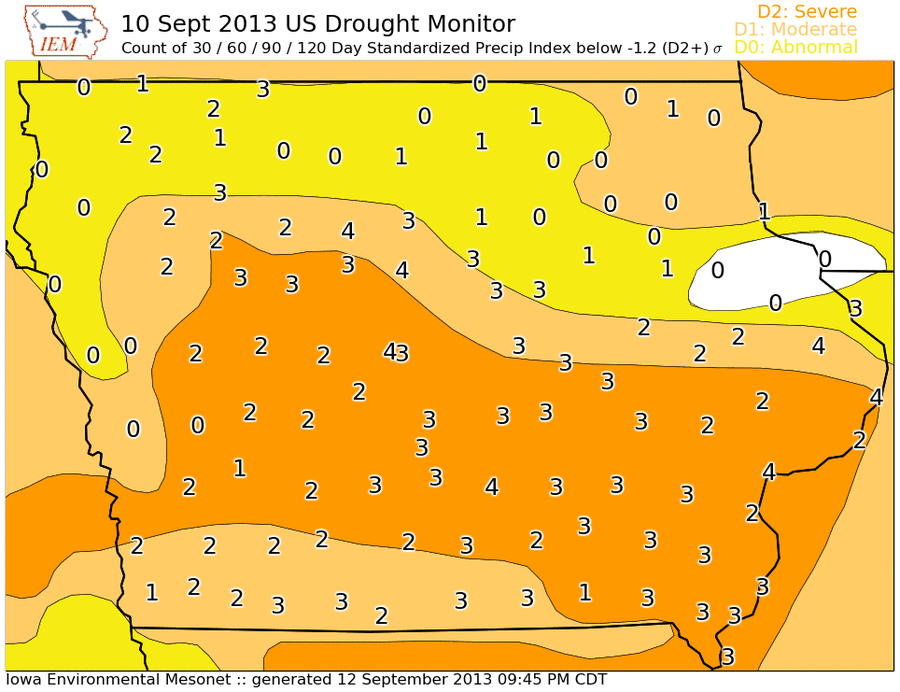
The United States Drought Monitor is a hand drawn analysis of weekly
drought condition in the country based on quantitative and qualitative
measures of drought. The featured map shows the most recent analysis
valid on the 10th. The entire state except about two counties is shown
in some level of drought condition. The plotted numbers are IEM
computed counts of the number of recent periods having a precipitation
departure of at least negative 1.2 standard deviations from average.
Four periods are shown covering the recent 30, 60, 90, and 120 days.
So if a location has a four plotted, each of those periods has a
precipitation departure worse than negative 1.2 sigma. The negative
1.2 level is about when "D2" drought is to be analyzed. The numbers
show the most consistently dry areas of the state are from central to
southeastern Iowa. Northeastern and extreme western Iowa have not been
as dry.
Voting:
Good = 202
Bad = 29
Tags: 2013 drought
Voting:
Good = 202
Bad = 29
Tags: 2013 drought

