Automated Data Plotter
This application dynamically generates many types of graphs derived from various IEM data sources. Feel free to use these generated graphics in whatever way you wish.
1 Select a Chart Type
2 Configure Chart Options
Plot Description:
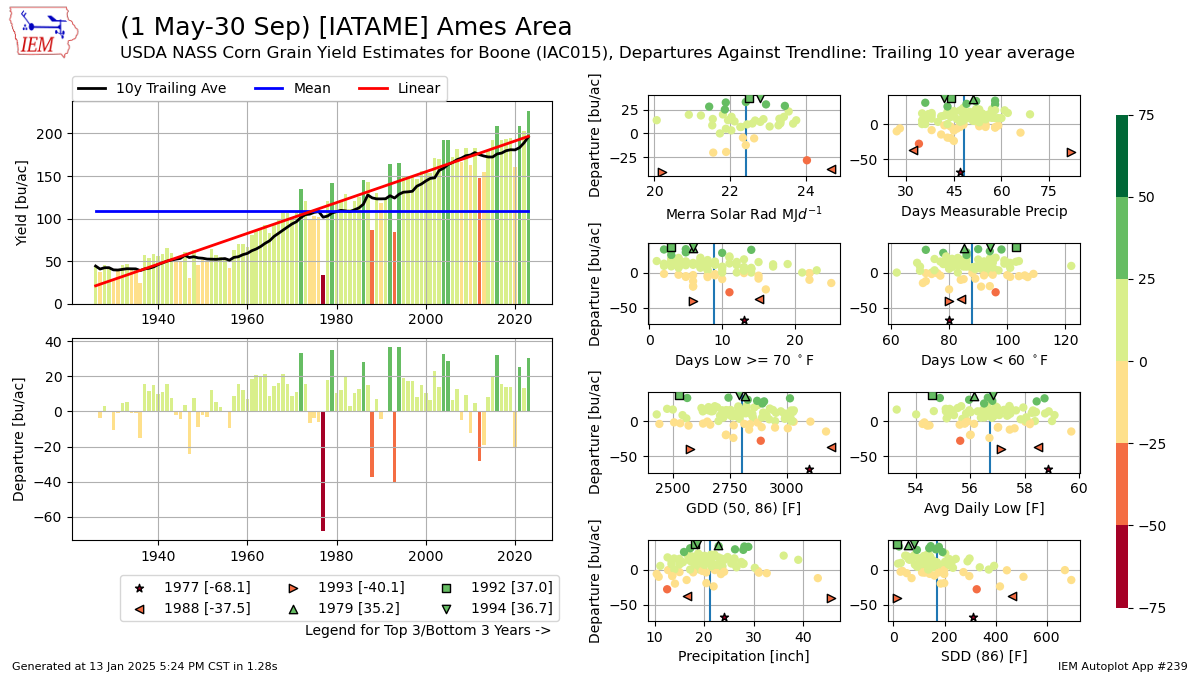
This autoplot combines the USDA NASS county yield estimates with summarized weather variables from a single weather station. The county that the weather station resides in is used for the comparison.If you select a statewide areal averaged weather station, you will get the statewide yield estimates and not an individual county. Unfortunately, there is nothing analogous for the climate/crop district weather values as those values are mostly missing within USDA NASS.
3 Generated Chart
Based on recent timings, plot generation averages 3 seconds. Please wait while your chart is being generated...
IEM Daily Features using this plot
The IEM Daily Features found on this website often utilize plots found on this application. Here is a listing of features referencing this plot type.
- 23 May 2025: Boone County Corn Yields
- 22 Mar 2023: Corn Yield Departures