IEM Daily Feature
Wednesday, 22 March 2023
Wednesday, 22 March 2023
Corn Yield Departures
Posted: 22 Mar 2023 05:30 AM
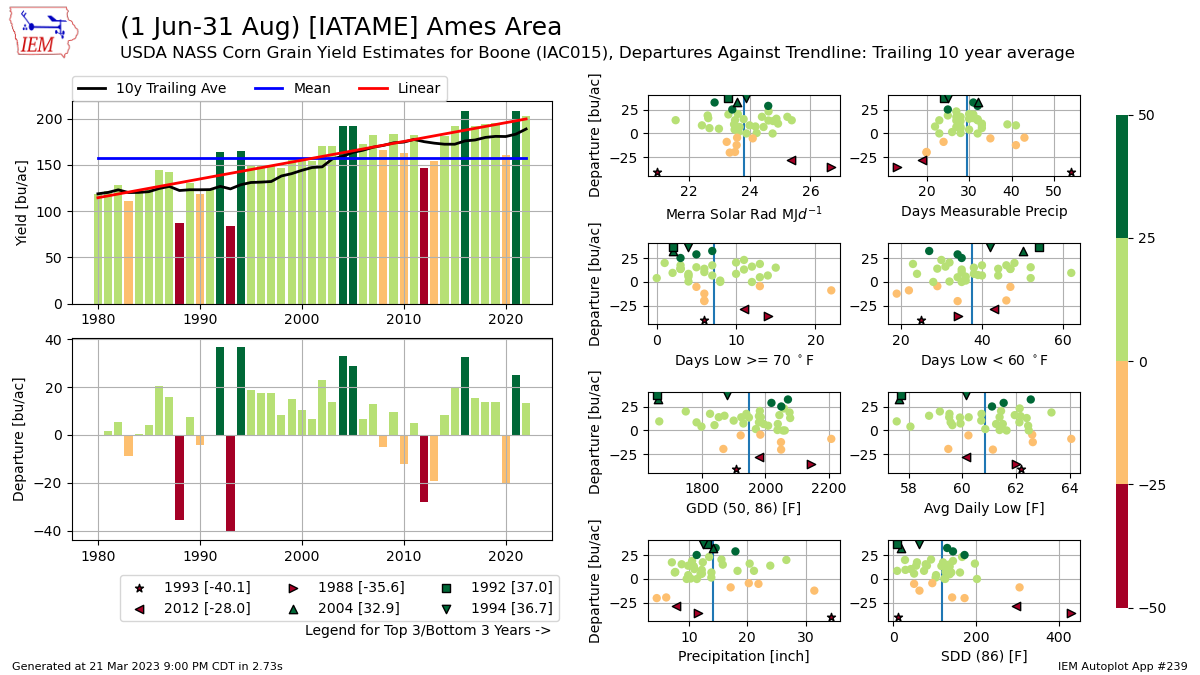
There is an entire industry and academic study built around attempting to correlate agricultural crop
yields and environmental data. So today's featured chart contains nothing groundbreaking, but
highlights a new autoplot tool on the IEM website that allows you to plot combinations of USDA NASS
county yield estimates and IEM tracked long term climate sites weather summary variables over a date
period of your choice. There's a lot going on with this plot! The upper left plot shows the raw yield
estimates for Boone County with three different trend lines plotted. The lower right plot shows the yearly
departures from a trailing ten year averaged trendline with the colors representing the magnitude of the
departures. Genetics and management continues to improve over the years, so the trendline allows
you to attempt to back out these changes and focus on the year to year variability from weather. These
departures are then plotted against eight summary weather metrics over the inclusive 1 June through
31 August period for Ames with the top three and bottom three departure years highlighted by special
icons. There are some intuitive relationships readily seen with the lack of precipitation and excess of
precipitation clearly leading to negative yield departures. If this interests you, try out the "Generate this
Chart on Website" link and see what relationships you can find :)
Voting:
Good = 11
Bad = 0
Abstain = 1
Voting:
Good = 11
Bad = 0
Abstain = 1

