Automated Data Plotter
This application dynamically generates many types of graphs derived from various IEM data sources. Feel free to use these generated graphics in whatever way you wish.
1 Select a Chart Type
2 Configure Chart Options
Plot Description:
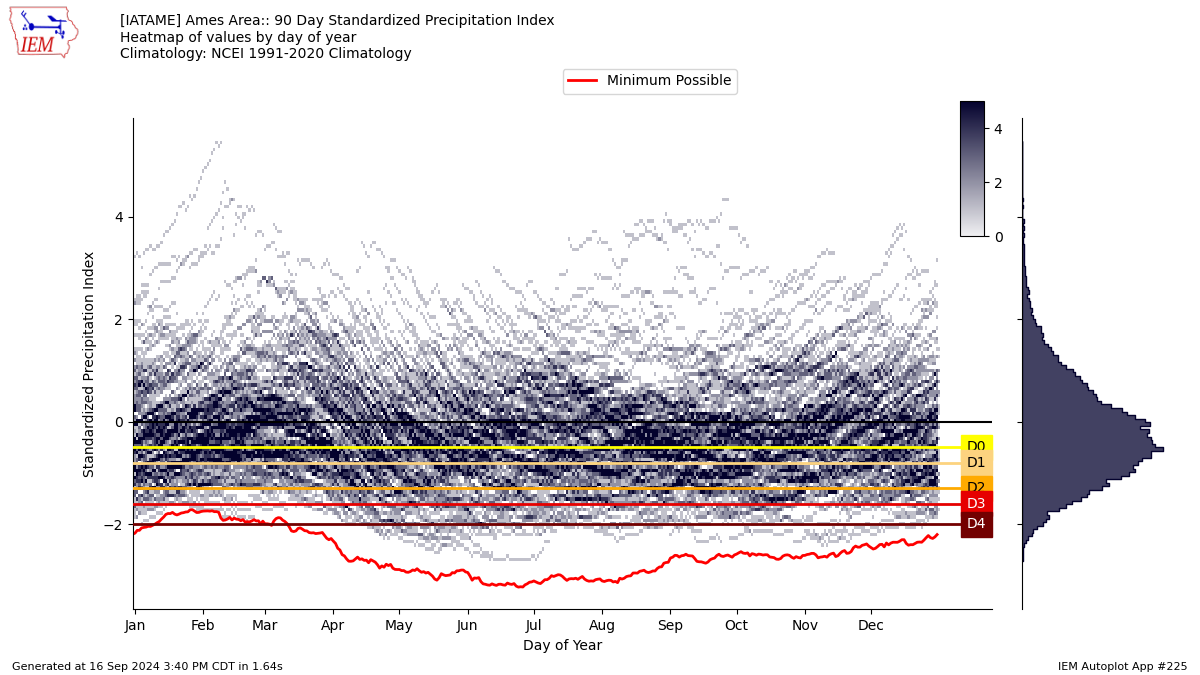
Departure from climatology metrics have an annual signal that is a function of the climatology. This plot shows the distribution of departure values.SPI is the standardized precipitation index. This is computed by using the NCEI 1991-2020 climatology to provide the average accumulation and the observed data to provide the standard deviation.
The Minimum Possible value presented is a function of the statistical metric being computed. For example, if the climatology accumation is 2 inches, the max negative departure can only be two inches.
3 Generated Chart
Based on recent timings, plot generation averages 6 seconds. Please wait while your chart is being generated...
IEM Daily Features using this plot
The IEM Daily Features found on this website often utilize plots found on this application. Here is a listing of features referencing this plot type.
- 15 Jan 2026: Possible 30 Day SPI
- 16 May 2024: Possible 90 Day Departures
- 03 Mar 2022: SPI Climatology