Past IEM Features tagged: variability
Smoothing Out Variability
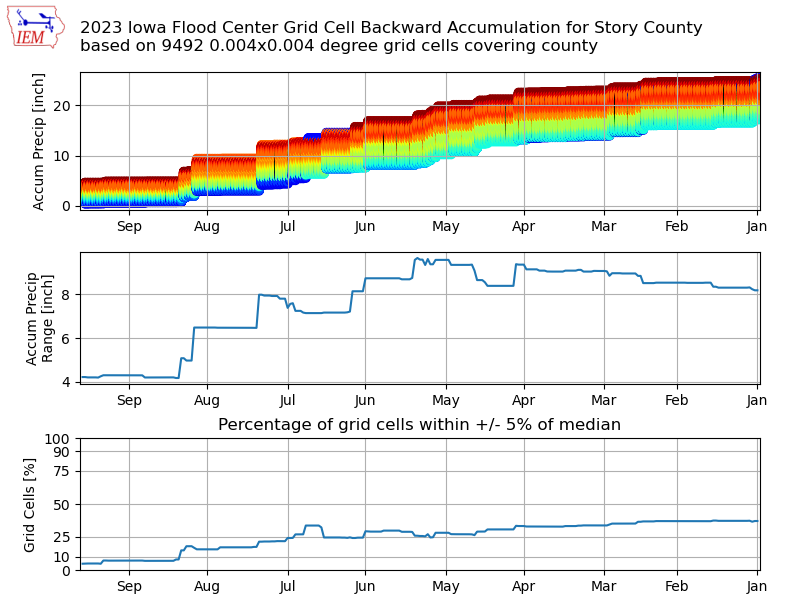
20 Sep 2023 05:30 AMSome training thunderstorms brought a highly localized heavy rainfall event to locations near and south of US-30 in central Iowa on Tuesday. As has been the case for other storm events this year, Story County (county of Ames) saw significant variability with totals ranging from about one to five inches! The featured chart is a bit of a thought experiment attempting to resolve if there is some period of time that washes this one event's variability out. The input data is provided by a high resolution precipitation product produced by the University of Iowa. There are just over 9,000 grid cells within the product covering Story County. The top panel accumulates the precipitation for each of these grid cells with the color representing the distribution of values on 19 September. The middle panel shows the range of values and the bottom panel shows the percentage of grid cells that are within 5% of the median value. So you can see that the initial four inch variability never goes away and increases with time. You may recall the big July event had a similar north/south gradient, so it certainly did not help to flip the gradient generated yesterday. This crude analyses only went back to 1 January, but it certainly would be interesting to extend it back to previous years to see how long it takes to tighten up the distribution.
Voting:
Good: 10
Bad: 2
Abstain: 1
Tags: variability
