Past IEM Features tagged: upperair
Mixing down
20 May 2009 06:22 AMThe featured map attempts to show why some locations in Iowa were able to reach the mid 90s while others only the lower 80s. The plotted values were the high temperature for Tuesday while the contour shows the potential temperature of air at 850 hPa (around a half mile above the ground). Given the higher potential temperature air in Northwest Iowa, strong winds were able to help mix down warmer air allowing for rapid warming and the warmest temperatures. One more day of really warm air is expected before a cool front places us back in the 70s for the end of the week.
Voting:
Good: 33
Bad: 10
Tags: upperair
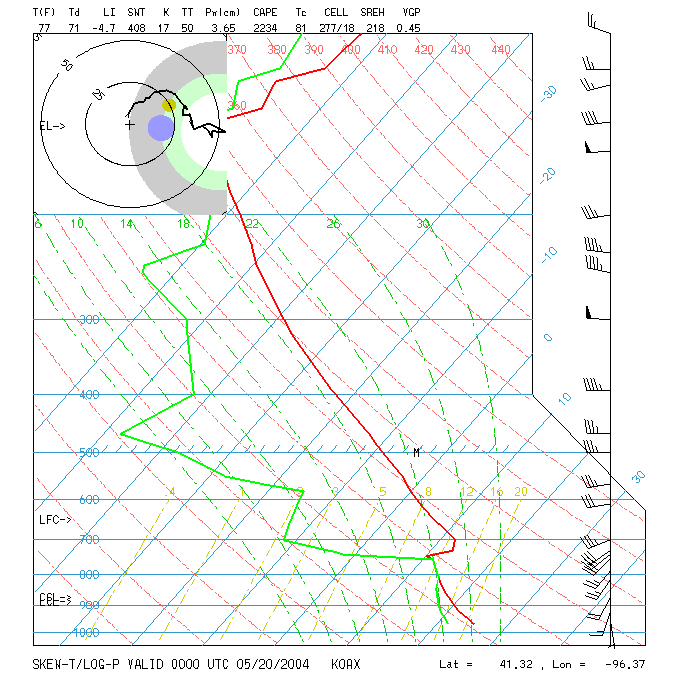
CAP, CAP, CAP
20 May 2004 06:59 AMMost of the multitude of storm chasers in Iowa yesterday were thwarted by a warm layer of air about a mile up in the atmosphere. The plot shows this warm layer (+12 C at 700 hPa). Updrafts have a tough time acquiring enough energy to punch through this layer to form storms.
Tags: upperair cap

