Past IEM Features tagged: jan18
Highly Variable January
05 Feb 2018 11:39 AMWith a h/t to @climatologist49 on Twitter, the just completed month of January was one of the most variable on record for Iowa and elsewhere. Where this variability is measured by the standard deviation of the daily high temperatures for the month as shown by the featured chart for the central Iowa averaged climate district. The year of 2018 comes in slightly ahead of 1942. This variability can be thought of as having a number of very warm days along with a number of very cold days for the month. February has continued this trend a day already in the 40s and one today in the teens for highs.
Voting:
Good: 10
Bad: 1
Abstain: 1
Tags: jan18
Mixed Bag for January
01 Feb 2018 05:35 AMThe featured map presents IEM estimated climate district areal averaged precipitation percentiles for January 2018. The map shows remarkable variability over the Midwest and especially over the high plains with a very wet area in Nebraska sandwiched by dry areas to its north and south. Of course, January climatology for precipitation is rather small to begin with so single events over an isolated area can goose these numbers a bunch. Having said that, the current situation in Iowa is depicted nicely with the southeastern portion seeing dry conditions again whereas other parts of the state got more precipitation.
Voting:
Good: 11
Bad: 0
Tags: jan18
Just shy of January Record
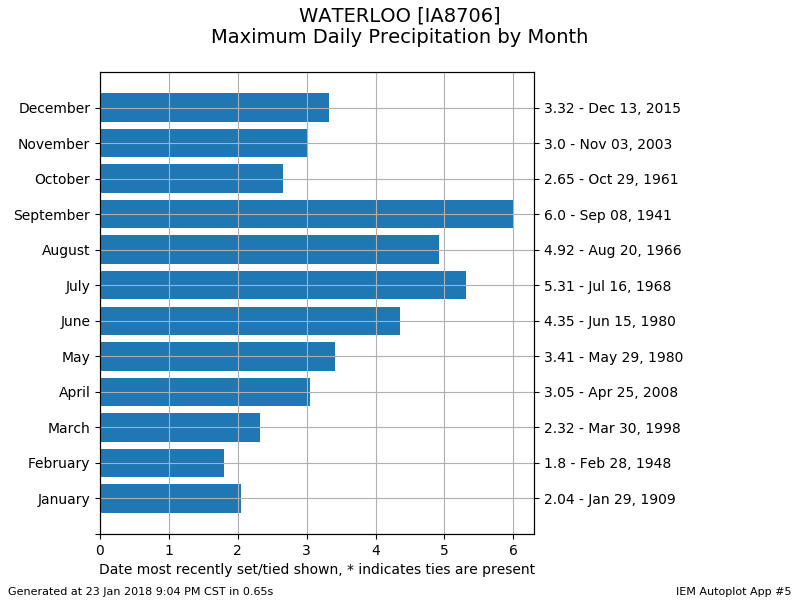
24 Jan 2018 05:33 AMThe most recent powerful winter storm system brought both heavy snow and rainfall to the state. The official daily total for Waterloo was just over two inches at 2.01 inches. This amount was just shy of setting a record for the site during January as shown by the featured chart of monthly maximum daily precipitation totals. The record shown on the chart was only three hundredths of an inch greater at 2.04 inches back on 29 Jan 1909.
Voting:
Good: 8
Bad: 2
Abstain: 1
Tags: jan18


