IEM Daily Feature
Friday, 02 July 2021
Friday, 02 July 2021
Precipitation Metrics
Posted: 02 Jul 2021 05:37 AM
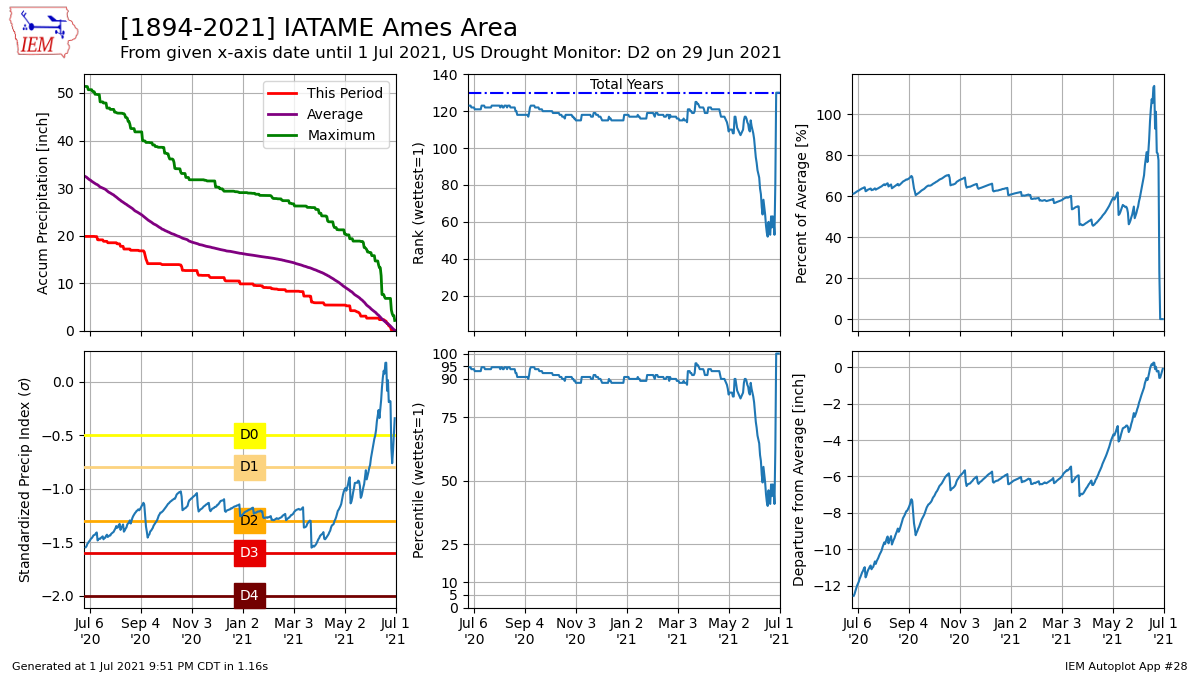
Drought concerns are increasing as warmer and drier weather is once again dominating the state.
The last half of June was wet for some portions of Iowa, but many areas missed out. The featured
chart presents a number of precipitation metrics for Ames. The individual charts express
precipitation metrics from the given date until 1 July 2021, so you may want to read them from right to
left. For example, the first few points of each line represent the 365 day period stretching back to
July 2020 and the last few points represent the last few days of data this year. The US Drought
Monitor is not a simple assignment of one single precipitation metric over one interval, but lookup
values do exist for the Standardized Precipitation Index (SPI) as highlighted by the lower left panel.
The current classification is D2 for Ames and the data supports that over the 60-90 day period. The
right most portion of each subplot should be taken with a grain of salt as a small number of days and
individual rain storms lead to noisy data.
Voting:
Good = 10
Bad = 1
Tags: precip
Voting:
Good = 10
Bad = 1
Tags: precip

