IEM Daily Feature
Friday, 24 August 2018
Friday, 24 August 2018
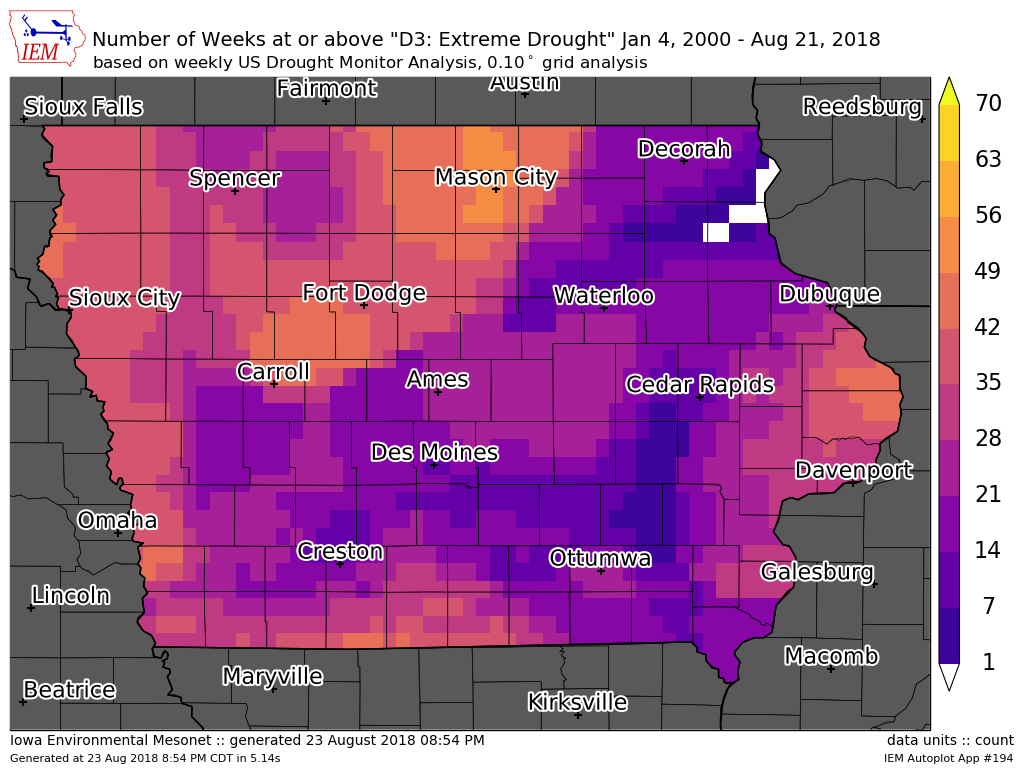
D3 Drought Frequency
Posted: 24 Aug 2018 05:34 AM
The weekly release of the US Drought Monitor was yesterday and it showed a continuing
degradation over southern Iowa. The area analyzed as "D3: Extreme Drought" was
expanded slightly. The featured map looks at the frequency expressed as number of weeks
since the year 2000 that a given location was at D3 or worse drought status. There is a
sliver of white shown over far northeastern Iowa, which indicates no D3 was present since
2000. If this map was expressed in percentage of all weeks, values would be less than 5%.
This level of drought is not all that common in the hence, hence the Extreme label.
Voting:
Good = 11
Bad = 1
Abstain = 2
Tags: drought
Voting:
Good = 11
Bad = 1
Abstain = 2
Tags: drought

