The following tables present IEM computed monthly data summaries based on
daily data provided by or computed for the IEM. A download interface
exists for the daily summary information. The climatology is provided by the
nearest NCEI climate station (USC00267820) within the current 1991-2020
dataset.
To load shown data into Microsoft Excel,
highlight the table information with your mouse and then copy/paste into Excel.
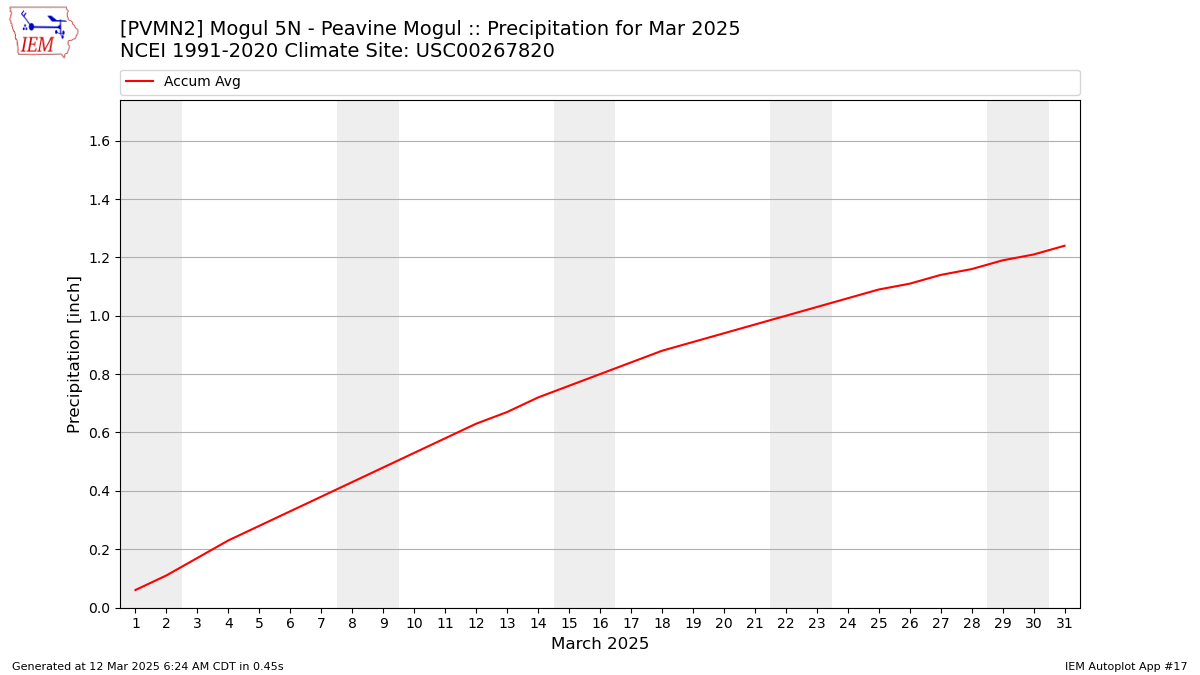
Precipitation Totals [inch]
Year
Jan
Feb
Mar
Apr
May
Jun
Jul
Aug
Sep
Oct
Nov
Dec
2022
M
M
M
M
M
M
M
M
M
M
M
M
2023
M
M
M
M
M
M
M
M
M
M
M
M
2024
M
M
M
M
M
M
M
M
M
M
M
M
2025
M
M
M
M
M
M
M
M
M
M
M
M
NCEI Climatology
1.59
1.60
1.24
0.48
0.59
0.51
0.39
0.19
0.32
0.76
1.15
2.20
Average Wind Speed [MPH]
Year
Jan
Feb
Mar
Apr
May
Jun
Jul
Aug
Sep
Oct
Nov
Dec
2022
M
M
M
M
M
M
M
M
M
M
M
M
2023
M
M
M
M
M
M
M
M
M
M
M
M
2024
M
M
M
M
M
M
M
M
M
M
M
M
2025
M
M
M
M
M
M
M
M
M
M
M
M
NCEI Climatology
M
M
M
M
M
M
M
M
M
M
M
M
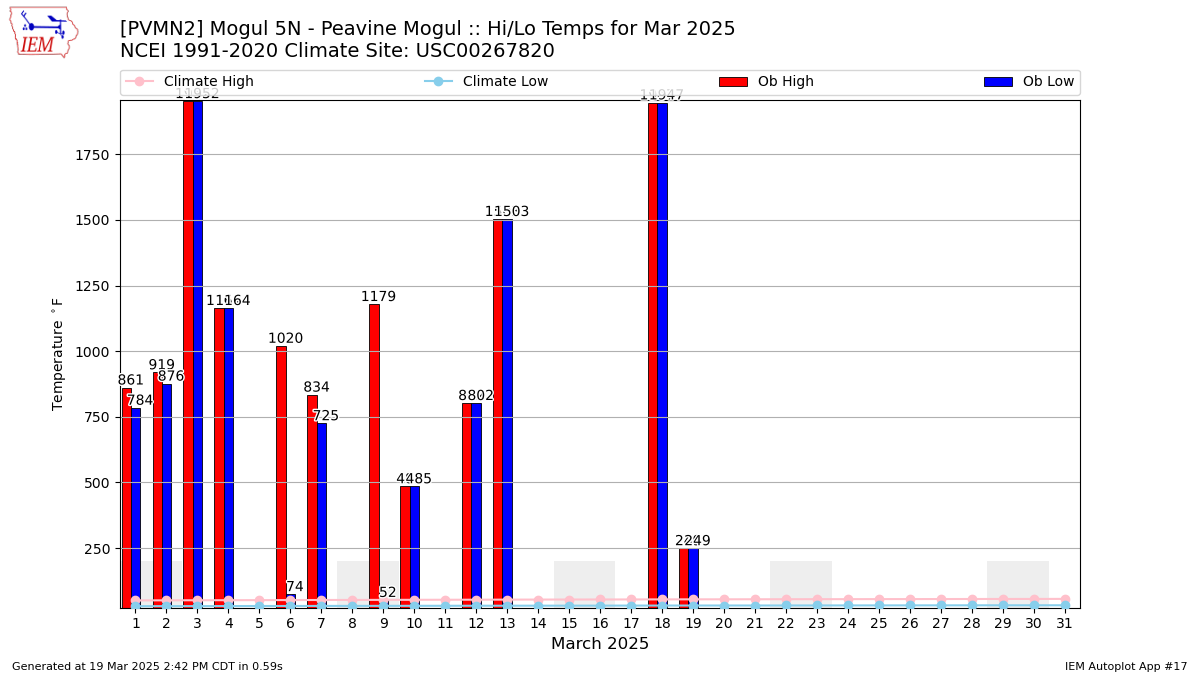
Average Daily High Temperature [F]
Year
Jan
Feb
Mar
Apr
May
Jun
Jul
Aug
Sep
Oct
Nov
Dec
2022
M
M
M
M
M
M
M
M
M
M
56.50
937.29
2023
1108.43
1101.95
836.71
1329.73
1121.00
1014.77
990.24
934.58
857.25
787.89
976.44
1109.00
2024
896.83
1030.44
1402.78
1104.74
1124.61
922.62
1298.06
1136.16
798.00
1026.20
989.45
1032.19
2025
1107.14
1249.06
1051.75
M
M
M
M
M
M
M
M
M
NCEI Climatology
43.40
47.32
53.89
59.51
68.99
79.20
88.80
87.11
79.40
66.30
52.39
43.09
Average Daily Low Temperature [F]
Year
Jan
Feb
Mar
Apr
May
Jun
Jul
Aug
Sep
Oct
Nov
Dec
2022
M
M
M
M
M
M
M
M
M
M
-28.00
-11.25
2023
17.83
35.00
12.33
15.60
13.00
0.60
12.33
-8.00
22.67
-35.33
-30.00
97.00
2024
83.00
94.00
1166.67
719.47
682.65
783.06
806.50
598.37
677.00
636.70
611.25
648.94
2025
887.36
1031.00
764.00
M
M
M
M
M
M
M
M
M
NCEI Climatology
23.90
26.48
30.60
34.70
42.20
49.01
56.90
54.60
47.61
37.20
28.50
23.71
Average Daily Temperature (high+low)/2 [F]
Year
Jan
Feb
Mar
Apr
May
Jun
Jul
Aug
Sep
Oct
Nov
Dec
2022
M
M
M
M
M
M
M
M
M
M
-28.00
267.12
2023
632.08
663.50
646.83
751.50
110.12
436.60
599.25
350.00
314.67
231.50
657.00
97.00
2024
183.00
195.50
1250.07
912.11
903.63
852.84
1052.28
867.26
737.50
831.45
800.35
840.56
2025
997.25
1140.03
907.88
M
M
M
M
M
M
M
M
M
NCEI Climatology
33.65
36.90
42.25
47.11
55.60
64.11
72.85
70.85
63.51
51.75
40.44
33.40
Average Relative Humidity [%]
This value is computed via a simple average of available observations weighted
by the duration between observations.