Information Last Ob Photographs Meteogram Network Table Neighbors Monthly Summaries Observation History Wind Roses Custom Wind Roses Data Calendar
| Feb 2025 | Mar 2025 | Apr 2025 | ||||
|---|---|---|---|---|---|---|
| Sunday | Monday | Tuesday | Wednesday | Thursday | Friday | Saturday |
| 23 | 24 | 25 | 26 | 27 | 28 | 01 High: 49.690395 Low: 24.490395 Precip: M Avg Wind: NNW @ 2.4 Gust: 10 (2:10 PM) RH% Min/Max: 38-78 Feel Min/Max: 24 to 50 |
| 02 High: 62.180588 Low: 26.130213 Precip: M Avg Wind: S @ 6.8 Gust: 35 (10:30 PM) RH% Min/Max: 15-80 Feel Min/Max: 23 to 62 | 03 High: 46.540394 Low: 34.550575 Precip: M Avg Wind: NW @ 8.2 Gust: 25 (4:50 PM) RH% Min/Max: 24-87 Feel Min/Max: 29 to 42 | 04 High: 45.390182 Low: 33.890022 Precip: M Avg Wind: NW @ 3.4 Gust: 14 (2:50 PM) RH% Min/Max: 38-91 Feel Min/Max: 29 to 43 | 05 High: 49.33037 Low: 35.650417 Precip: M Avg Wind: SSW @ 3.2 Gust: 21 (1:50 PM) RH% Min/Max: 34-92 Feel Min/Max: 32 to 49 | 06 High: 42.150204 Low: 30.039808 Precip: M Avg Wind: S @ 7.4 Gust: 37 (3:30 PM) RH% Min/Max: 54-92 Feel Min/Max: 24 to 41 | 07 High: 38.010223 Low: 28.020191 Precip: M Avg Wind: NW @ 4.2 Gust: 17 (6:10 PM) RH% Min/Max: 53-94 Feel Min/Max: 21 to 37 | 08 High: 42.909798 Low: 22.569818 Precip: M Avg Wind: WSW @ 3.4 Gust: 12 (5:40 PM) RH% Min/Max: 44-88 Feel Min/Max: 18 to 42 |
| 09 High: 54.860012 Low: 25.680214 Precip: M Avg Wind: S @ 3.1 Gust: 11 (2:10 PM) RH% Min/Max: 25-78 Feel Min/Max: 20 to 55 | 10 High: 56.629414 Low: 31.060383 Precip: M Avg Wind: NNW @ 4.0 Gust: 12 (4:50 PM) RH% Min/Max: 28-74 Feel Min/Max: 28 to 57 | 11 High: 60.330215 Low: 31.899189 Precip: M Gust: 24 (3:20 PM) RH% Min/Max: 17-71 Feel Min/Max: 26 to 60 | 12 Precip: M | 13 Precip: M | 14 | 15 |
| 16 | 17 | 18 | 19 | 20 | 21 | 22 |
| 23 | 24 | 25 | 26 | 27 | 28 | 29 |
| 30 | 31 | 01 | 02 | 03 | 04 | 05 |
The data presented here provided by IEM API webservice: daily.json. A simple CSV option exists as well.
Daily High/Low Plot
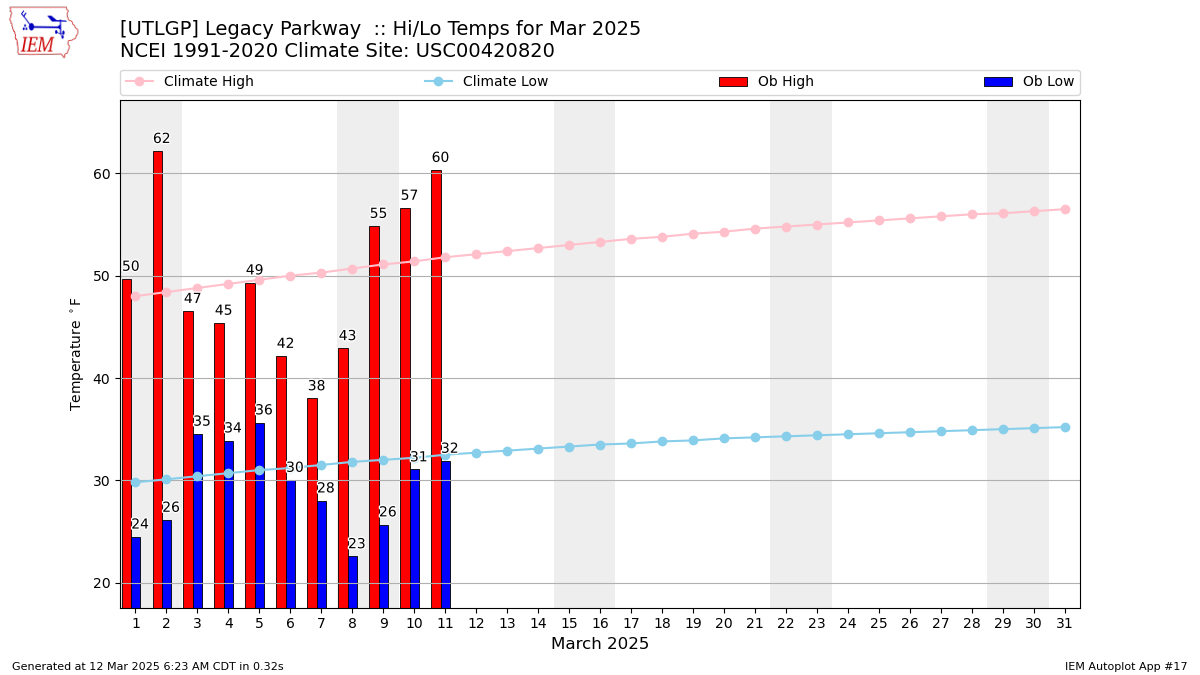
Description: This chart of the monthly temperature data. The bars are the observations and the dots are climatology.
Daily Rainfall
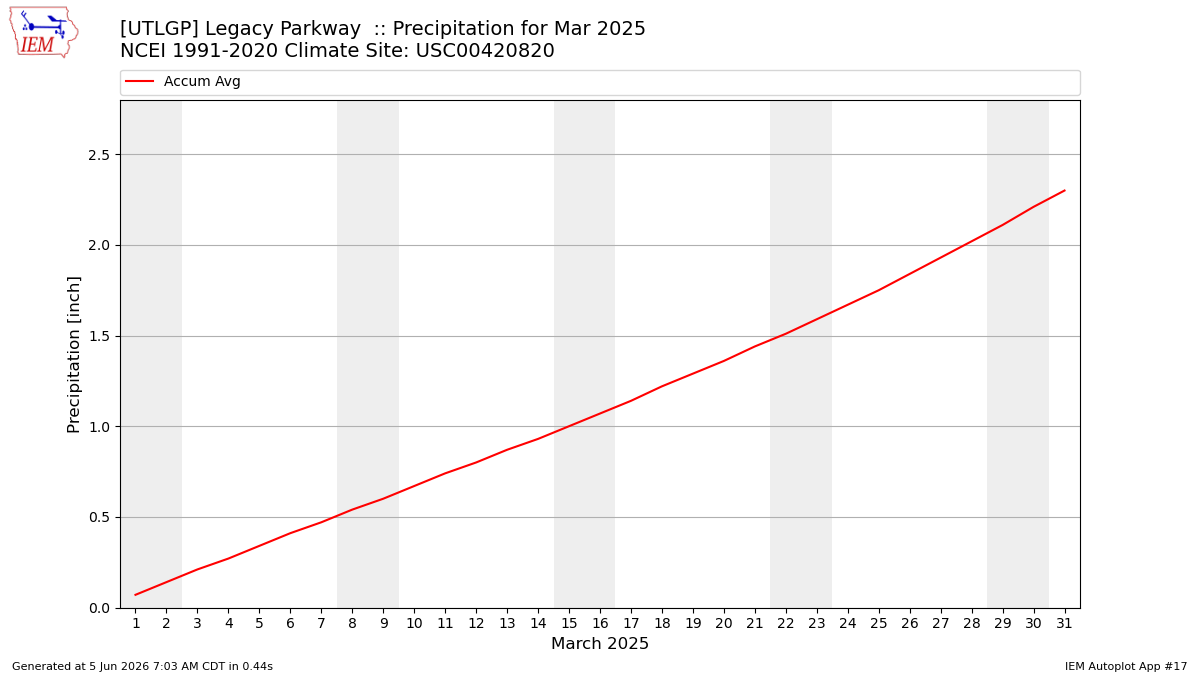
Description: This chart is of daily precipitation for the month. The red line would be an average month while the blue line and bars are observations.
Daily Average Wind Speeds

Description: This chart is of the daily average wind speeds.
The data presented here provided by IEM API webservice: daily.json. A simple CSV option exists as well.