Information Last Ob Photographs Meteogram Network Table Neighbors Monthly Summaries Observation History Wind Roses Custom Wind Roses Data Calendar
| Feb 2025 | Mar 2025 | Apr 2025 | ||||
|---|---|---|---|---|---|---|
| Sunday | Monday | Tuesday | Wednesday | Thursday | Friday | Saturday |
| 23 | 24 | 25 | 26 | 27 | 28 | 01 High: 55.05079 Low: 22.690393 Precip: M Avg Wind: NW @ 4.2 Gust: 15 (8:20 PM) RH% Min/Max: 29-91 Feel Min/Max: 21 to 55 |
| 02 High: 62.72062 Low: 28.020191 Precip: M Avg Wind: S @ 15.2 Gust: 41 (1:40 PM) RH% Min/Max: 12-73 Feel Min/Max: 20 to 63 | 03 High: 47.4494 Low: 28.430586 Precip: M Avg Wind: W @ 8.8 Gust: 31 (4:30 PM) RH% Min/Max: 33-92 Feel Min/Max: 22 to 44 | 04 High: 49.780373 Low: 33.110596 Precip: M Avg Wind: NNW @ 6.1 Gust: 21 (11:30 AM) RH% Min/Max: 32-93 Feel Min/Max: 30 to 48 | 05 High: 48.3098 Low: 28.329786 Precip: M Avg Wind: S @ 7.2 Gust: 29 (11:50 PM) RH% Min/Max: 38-90 Feel Min/Max: 26 to 46 | 06 High: 43.100574 Low: 31.010012 Precip: M Avg Wind: S @ 16.2 Gust: 35 (4:00 AM) RH% Min/Max: 72-100 Feel Min/Max: 19 to 34 | 07 High: 38.499775 Low: 27.719606 Precip: M Avg Wind: NNW @ 9.7 Gust: 29 (4:50 PM) RH% Min/Max: 56-100 Feel Min/Max: 18 to 32 | 08 High: 46.560226 Low: 22.290821 Precip: M Avg Wind: SSW @ 4.3 Gust: 18 (1:10 PM) RH% Min/Max: 44-89 Feel Min/Max: 15 to 47 |
| 09 High: 55.650204 Low: 28.200203 Precip: M Avg Wind: S @ 7.5 Gust: 18 (3:00 PM) RH% Min/Max: 30-81 Feel Min/Max: 21 to 56 | 10 High: 59.939594 Low: 33.6308 Precip: M Avg Wind: SSW @ 7.1 Gust: 19 (3:50 PM) RH% Min/Max: 17-73 Feel Min/Max: 28 to 60 | 11 High: 61.509212 Low: 35.209427 Precip: M Gust: 25 (12:10 PM) RH% Min/Max: 16-73 Feel Min/Max: 29 to 62 | 12 Precip: M | 13 Precip: M | 14 | 15 |
| 16 | 17 | 18 | 19 | 20 | 21 | 22 |
| 23 | 24 | 25 | 26 | 27 | 28 | 29 |
| 30 | 31 | 01 | 02 | 03 | 04 | 05 |
The data presented here provided by IEM API webservice: daily.json. A simple CSV option exists as well.
Daily High/Low Plot
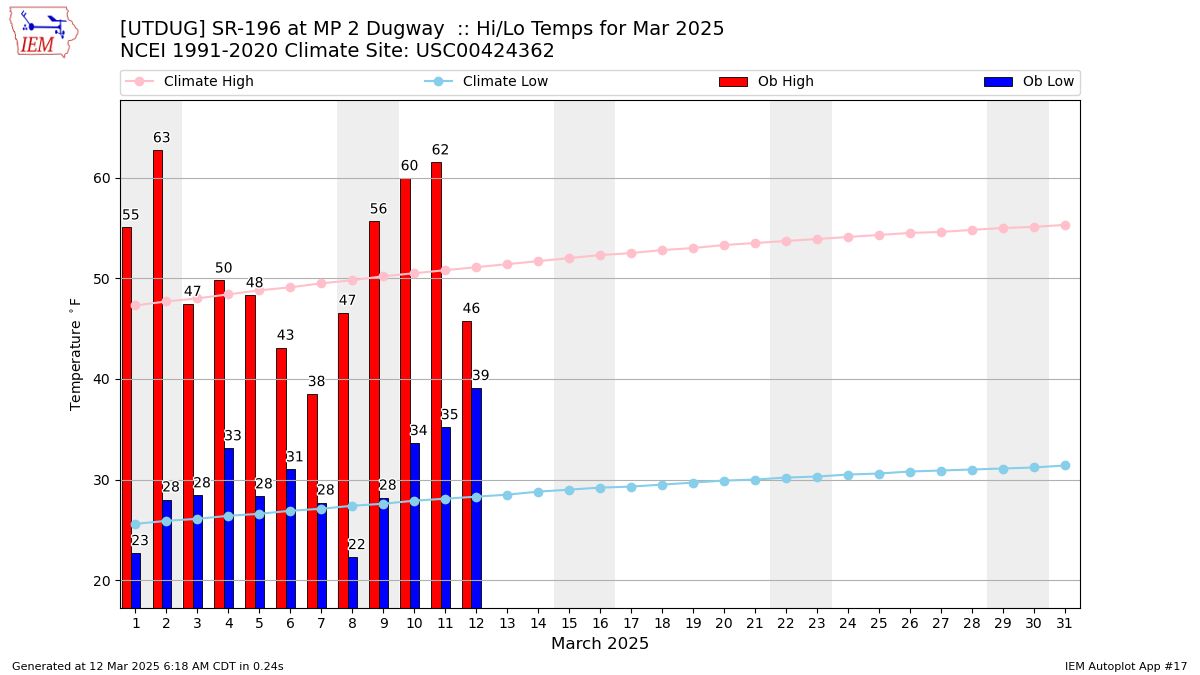
Description: This chart of the monthly temperature data. The bars are the observations and the dots are climatology.
Daily Rainfall

Description: This chart is of daily precipitation for the month. The red line would be an average month while the blue line and bars are observations.
Daily Average Wind Speeds

Description: This chart is of the daily average wind speeds.
The data presented here provided by IEM API webservice: daily.json. A simple CSV option exists as well.