Information Last Ob Photographs Meteogram Network Table Neighbors Monthly Summaries Observation History Wind Roses Custom Wind Roses Data Calendar
| Feb 2025 | Mar 2025 | Apr 2025 | ||||
|---|---|---|---|---|---|---|
| Sunday | Monday | Tuesday | Wednesday | Thursday | Friday | Saturday |
| 23 | 24 | 25 | 26 | 27 | 28 | 01 High: 67.20079 Low: 16.399403 Precip: M Avg Wind: N @ 0.0 RH% Min/Max: 10-64 Feel Min/Max: 50 to 67 |
| 02 High: 57.500576 Low: 16.800789 Precip: M Avg Wind: N @ 0.0 RH% Min/Max: 18-71 Feel Min/Max: 50 to 58 | 03 High: 51.200577 Low: 20.600574 Precip: M Avg Wind: N @ 0.0 RH% Min/Max: 36-84 Feel Min/Max: 50 to 51 | 04 High: 58.20079 Low: 16.399403 Precip: M Avg Wind: N @ 0.0 RH% Min/Max: 21-85 Feel Min/Max: 50 to 58 | 05 High: 53.99962 Low: 19.999403 Precip: M Avg Wind: N @ 0.0 RH% Min/Max: 29-83 Feel Min/Max: 50 to 54 | 06 High: 40.49962 Low: 32.500416 Precip: M Avg Wind: N @ 0.0 RH% Min/Max: 63-96 | 07 High: 45.1994 Low: 28.700575 Precip: M Avg Wind: N @ 0.0 RH% Min/Max: 45-92 | 08 High: 51.69919 Low: 23.300575 Precip: M Avg Wind: N @ 0.0 RH% Min/Max: 29-88 Feel Min/Max: 50 to 52 |
| 09 High: 59.300575 Low: 19.000416 Precip: M Avg Wind: N @ 0.0 RH% Min/Max: 17-90 Feel Min/Max: 50 to 59 | 10 High: 62.70079 Low: 19.000416 Precip: M Avg Wind: N @ 0.0 RH% Min/Max: 13-89 Feel Min/Max: 50 to 63 | 11 High: 59.300575 Low: 25.59919 Precip: M Avg Wind: N @ 0.0 RH% Min/Max: 18-83 Feel Min/Max: 50 to 59 | 12 High: 41.300575 Low: 31.699404 Precip: M RH% Min/Max: 64-82 | 13 Precip: M | 14 | 15 |
| 16 | 17 | 18 | 19 | 20 | 21 | 22 |
| 23 | 24 | 25 | 26 | 27 | 28 | 29 |
| 30 | 31 | 01 | 02 | 03 | 04 | 05 |
The data presented here provided by IEM API webservice: daily.json. A simple CSV option exists as well.
Daily High/Low Plot
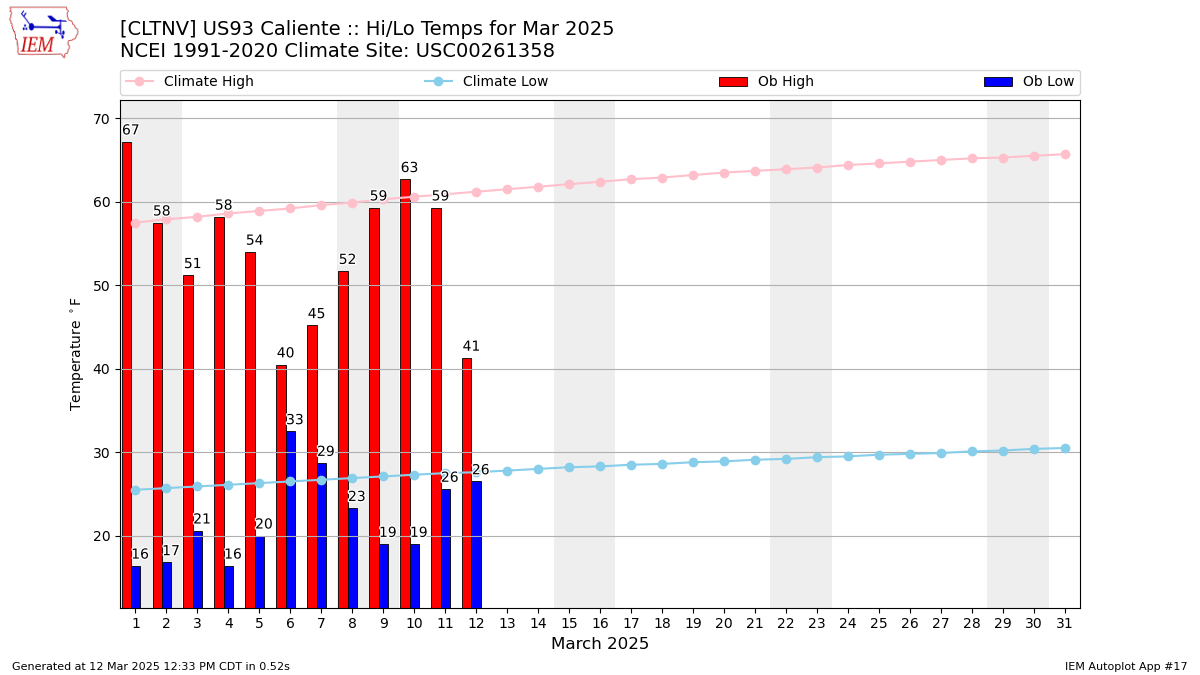
Description: This chart of the monthly temperature data. The bars are the observations and the dots are climatology.
Daily Rainfall

Description: This chart is of daily precipitation for the month. The red line would be an average month while the blue line and bars are observations.
Daily Average Wind Speeds

Description: This chart is of the daily average wind speeds.
The data presented here provided by IEM API webservice: daily.json. A simple CSV option exists as well.