Information Last Ob Photographs Meteogram Network Table Neighbors Monthly Summaries Observation History Wind Roses Custom Wind Roses Data Calendar
| Dec 2024 | Jan 2025 | Feb 2025 | ||||
|---|---|---|---|---|---|---|
| Sunday | Monday | Tuesday | Wednesday | Thursday | Friday | Saturday |
| 29 | 30 | 31 | 01 Precip: M | 02 High: 37.040024 Low: 32.18 Precip: 0.01 Gust: 29 (2:15 PM) RH% Min/Max: 65-90 Feel Min/Max: 25 to 37 | 03 High: 42.44002 Low: 34.340023 Precip: 0.00 Gust: 27 (9:30 AM) RH% Min/Max: 65-96 Feel Min/Max: 25 to 36 | 04 High: 34.16001 Low: 28.219978 Precip: 0.23 Gust: 21 (5:30 PM) RH% Min/Max: 79-99 Feel Min/Max: 18 to 34 |
| 05 High: 30.740023 Low: 25.88 Precip: 0.29 Gust: 11 (5:45 PM) RH% Min/Max: 85-99 Feel Min/Max: 22 to 30 | 06 High: 33.799988 Low: 18.140022 Precip: 0.03 Gust: 21 (1:45 PM) RH% Min/Max: 83-99 Feel Min/Max: 9 to 34 | 07 High: 26.96001 Low: 10.760011 Precip: 0.00 Gust: 19 (12:30 PM) RH% Min/Max: 65-95 Feel Min/Max: 1 to 25 | 08 High: 18.499989 Low: 7.699989 Precip: 0.04 Gust: 24 (12:15 PM) RH% Min/Max: 89-94 Feel Min/Max: -10 to 18 | 09 High: 26.78 Low: 9.860011 Precip: 0.00 Gust: 20 (3:45 PM) RH% Min/Max: 61-95 Feel Min/Max: -1 to 27 | 10 High: 24.440022 Low: 8.599989 Precip: 0.17 Gust: 22 (2:45 AM) RH% Min/Max: 79-97 Feel Min/Max: -7 to 16 | 11 High: 24.619978 Low: 21.56001 Precip: 0.33 Gust: 28 (9:45 AM) RH% Min/Max: 84-97 Feel Min/Max: 7 to 24 |
| 12 High: 22.819979 Low: 15.4400215 Precip: 0.01 Gust: 18 (2:15 AM) RH% Min/Max: 81-97 Feel Min/Max: 6 to 21 | 13 High: 19.58 Low: 15.4400215 Precip: 0.10 Gust: 20 (2:00 PM) RH% Min/Max: 79-93 Feel Min/Max: 4 to 19 | 14 High: 23.540022 Low: 17.240023 Precip: 0.00 Gust: 13 (1:15 AM) RH% Min/Max: 75-93 Feel Min/Max: 8 to 23 | 15 High: 29.119978 Low: 18.140022 Precip: 0.00 Gust: 20 (11:45 PM) RH% Min/Max: 64-93 Feel Min/Max: 5 to 25 | 16 High: 30.19999 Low: 12.740022 Precip: 0.00 Gust: 32 (7:15 AM) RH% Min/Max: 66-93 Feel Min/Max: -7 to 24 | 17 High: 27.319979 Low: 9.68 Precip: 0.28 Gust: 28 (12:45 PM) RH% Min/Max: 81-97 Feel Min/Max: 4 to 27 | 18 High: 14.18 Low: -0.22 Precip: 0.00 Gust: 63 (7:00 PM) RH% Min/Max: 57-91 Feel Min/Max: -16 to 14 |
| 19 High: 13.28 Low: 0.1399945 Precip: 0.01 Gust: 20 (5:30 AM) RH% Min/Max: 75-89 Feel Min/Max: -18 to 13 | 20 High: 6.799989 Low: -14.62 Precip: 0.00 Gust: 21 (11:30 PM) RH% Min/Max: 42-81 Feel Min/Max: -31 to -0 | 21 High: 18.319979 Low: -10.300011 Precip: 0.00 Gust: 28 (6:15 AM) RH% Min/Max: 48-80 Feel Min/Max: -36 to 9 | 22 High: 17.419977 Low: -0.7600055 Precip: 0.00 Gust: 15 (3:31 PM) RH% Min/Max: 60-88 Feel Min/Max: -13 to 16 | 23 High: 19.219978 Low: -4.72 Precip: 0.00 Gust: 24 (11:00 AM) RH% Min/Max: 57-87 Feel Min/Max: -25 to 9 | 24 High: 19.940022 Low: 7.699989 Precip: 0.17 Gust: 23 (6:30 AM) RH% Min/Max: 63-94 Feel Min/Max: -10 to 20 | 25 High: 26.599989 Low: 3.9199781 Precip: 0.00 Gust: 24 (10:45 AM) RH% Min/Max: 44-93 Feel Min/Max: -9 to 16 |
| 26 High: 17.96001 Low: -5.2600055 Precip: 0.00 Gust: 28 (12:15 PM) RH% Min/Max: 51-87 Feel Min/Max: -27 to 3 | 27 High: 21.019978 Low: -6.339989 Precip: 0.00 Gust: 29 (10:45 AM) RH% Min/Max: 46-86 Feel Min/Max: -30 to 9 | 28 High: 27.499989 Low: -1.8399891 Precip: 0.00 Gust: 28 (8:45 AM) RH% Min/Max: 49-87 Feel Min/Max: -24 to 16 | 29 High: 24.98 Low: -0.039989013 Precip: 0.00 Gust: 26 (12:00 AM) RH% Min/Max: 59-89 Feel Min/Max: -21 to 25 | 30 High: 25.69999 Low: -2.3799944 Precip: 0.00 Gust: 22 (11:00 PM) RH% Min/Max: 57-90 Feel Min/Max: -22 to 26 | 31 High: 33.61998 Low: 2.299989 Precip: 0.06 Gust: 30 (9:15 AM) RH% Min/Max: 46-97 Feel Min/Max: -19 to 27 | 01 |
The data presented here provided by IEM API webservice: daily.json. A simple CSV option exists as well.
Daily High/Low Plot
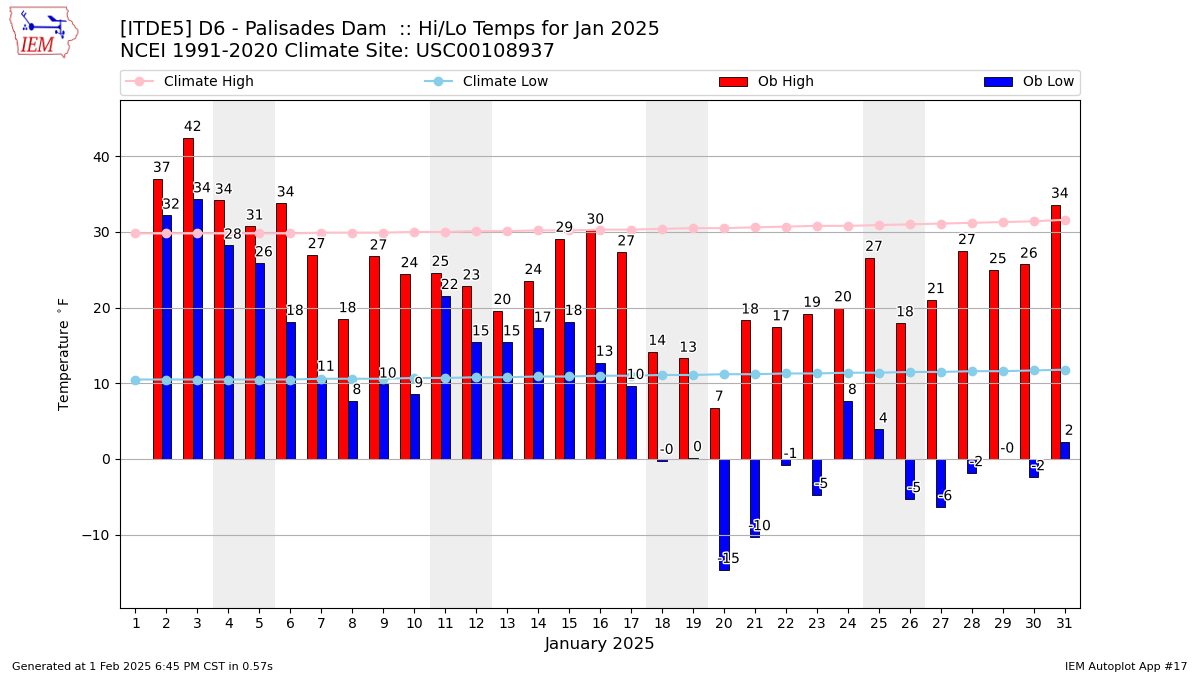
Description: This chart of the monthly temperature data. The bars are the observations and the dots are climatology.
Daily Rainfall
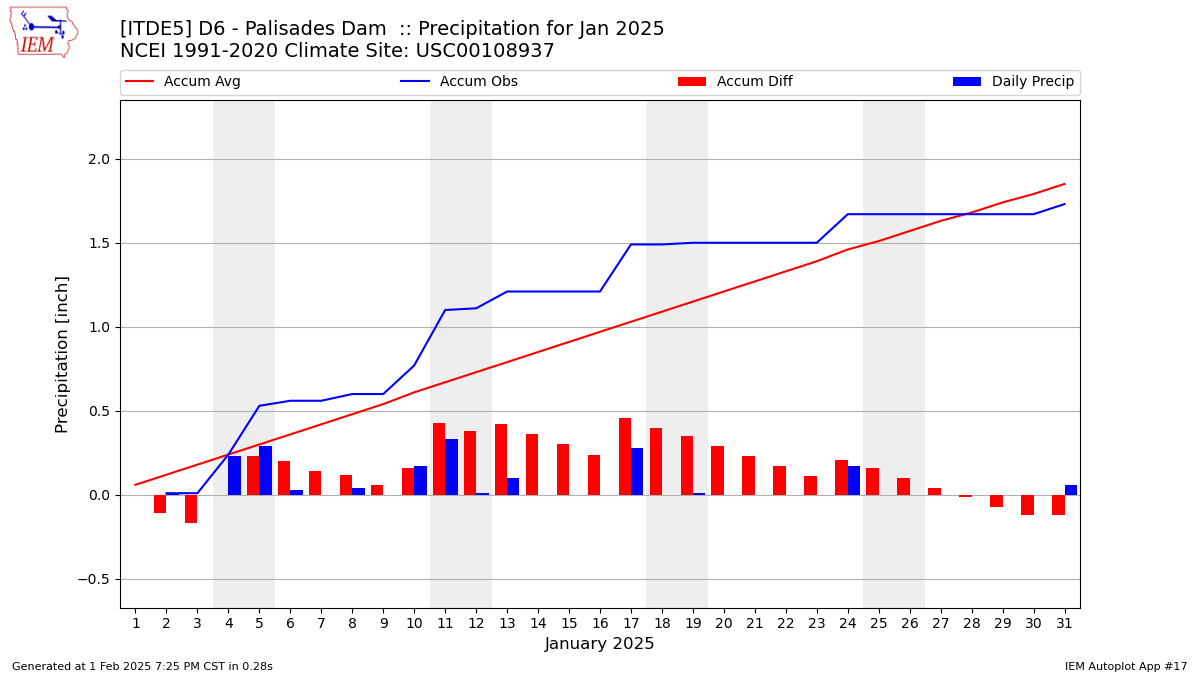
Description: This chart is of daily precipitation for the month. The red line would be an average month while the blue line and bars are observations.
Daily Average Wind Speeds
Description: This chart is of the daily average wind speeds.
The data presented here provided by IEM API webservice: daily.json. A simple CSV option exists as well.