Automated Data Plotter
This application dynamically generates many types of graphs derived from various IEM data sources. Feel free to use these generated graphics in whatever way you wish.
1 Select a Chart Type
2 Configure Chart Options
Plot Description:
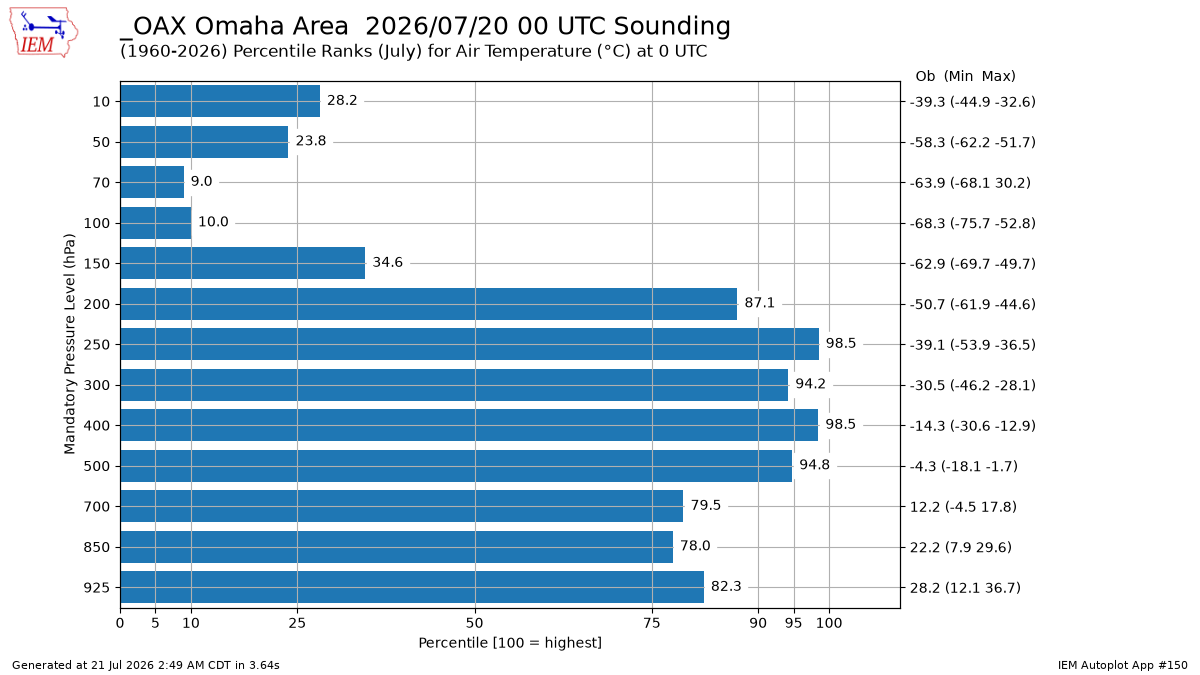
This plot presents percentiles of observations from a given sounding profile against the long term record for the site. These percentiles are computed against all other soundings for the valid hour of the profile of interest. For example, a 00 UTC sounding is only compared against other 00 UTC soundings for the given month or for the period of record. Since 18 UTC soundings are now more common, these are compared against 00 UTC climatology.The 'Select Station' option provides some 'virtual' stations that are spliced together archives of close by stations. For some locations, the place that the sounding is made has moved over the years.
A process runs at 3:10 and 15:10z each day to ingest the current soundings. You may not find the current day's sounding if running this application prior to those ingest times.
3 Generated Chart
Based on recent timings, plot generation averages 5 seconds. Please wait while your chart is being generated...
If you notice plotting issues with the image above, please
contact us
and provide the URL address currently shown by your web browser.
IEM Daily Features using this plot
The IEM Daily Features found on this website often utilize plots found on this application. Here is a listing of features referencing this plot type.
- 18 Sep 2025: Weak Winds Aloft
- 30 Jan 2025: Warmth Above Us
- 13 Dec 2023: Extreme Dryness
- 14 Mar 2023: Cold Profile
- 11 Jan 2021: Un-Energetic
- 02 Jul 2019: Calm Aloft
- 18 Dec 2018: Temperatures Above Us
- 24 May 2017: Cold Air Above Us
- 20 Jun 2016: High Heights