IEM Daily Feature
Saturday, 20 April 2024
Saturday, 20 April 2024
Eclipse Solar Radiation
Posted: 20 Apr 2024 08:03 AM
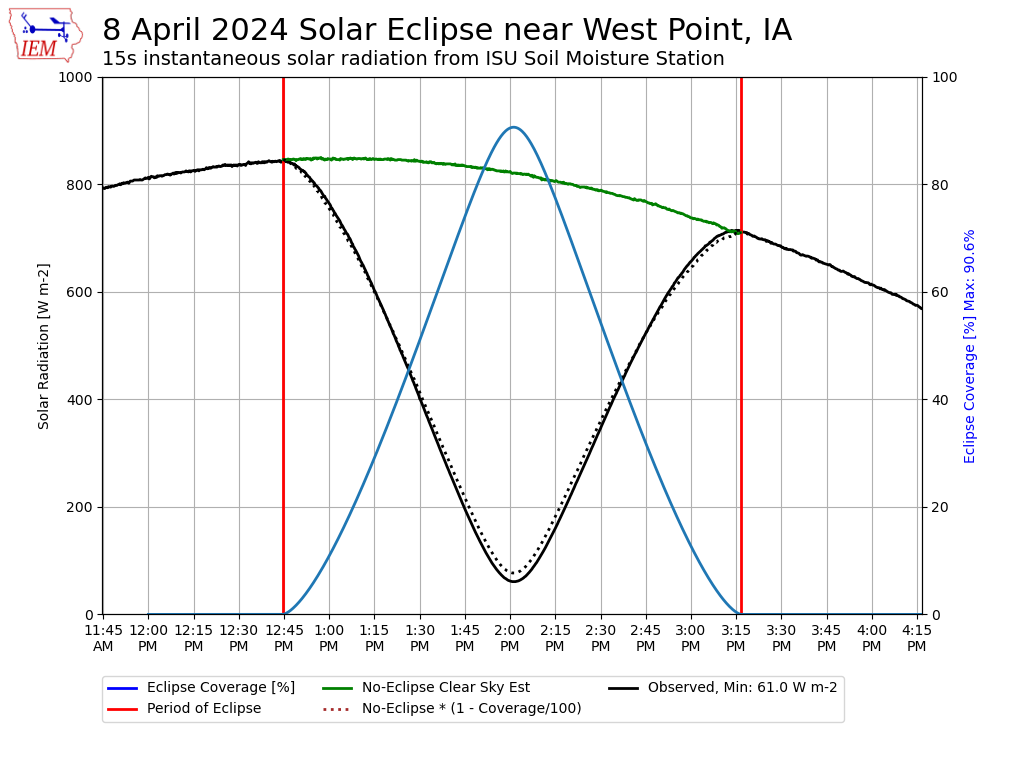
For the 8 April eclipse, the ISU Soil Moisture Network put its southeastern most station (near West Point, IA) into a rapid scan mode to observe atmospheric variables at a 15 second interval. This station subsequently suffered a communications outage and did not come back online until yesterday! So with this data in hand now, a daily featured chart should at least be made. The chart focuses in on the eclipse period and attempts to address the question if the percentage of the sun covered by the moon is linear to the decrease in received solar radiation. The black line shows the 15 second observations, the red lines denote the period of the eclipse, the green line is an estimate of received radiation if the sky was clear and there was not an eclipse, the blue line is the eclipse coverage percentage, and the black dashed line represents the linear model. So while the relationship looks good and intuitive, it is not exact as the impact of received radiation is very nuanced with lots of small effects causing small variances in this linear model. If you want details on the minutia involved, ask Google Scholar.
Voting:
Good = 19
Bad = 0
Tags: eclipse
Voting:
Good = 19
Bad = 0
Tags: eclipse

