IEM Daily Feature
Wednesday, 08 November 2023
Wednesday, 08 November 2023
Meandering Around
Posted: 08 Nov 2023 05:30 AM
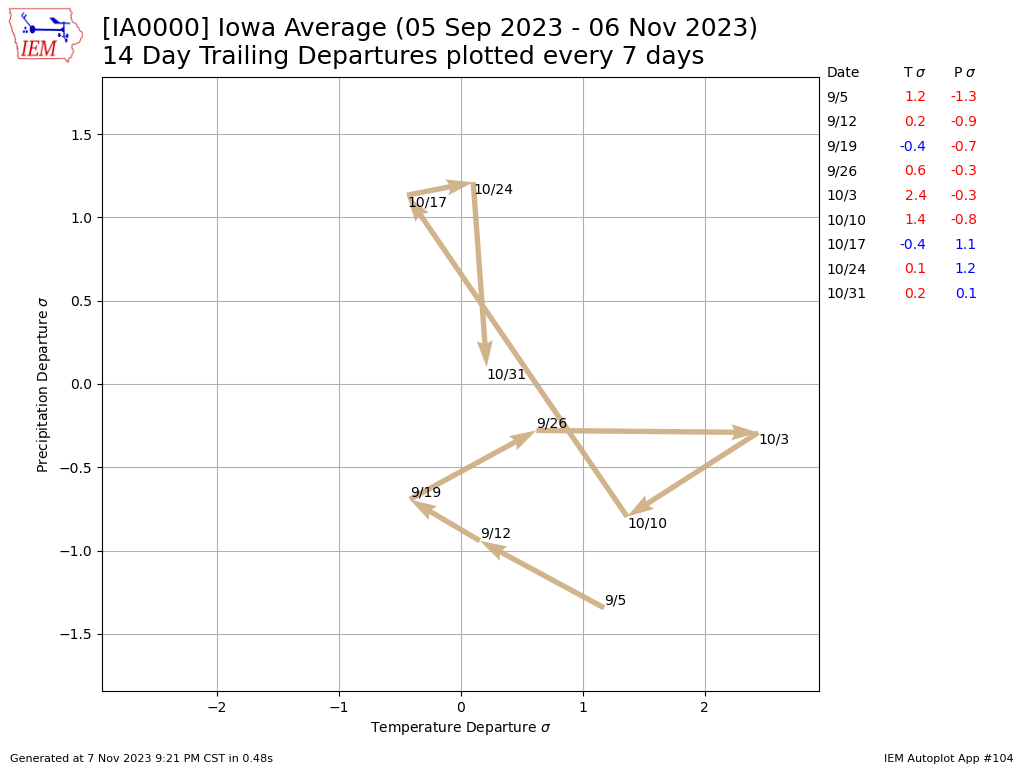
The featured chart presents the weekly progression of a trailing two week standard deviation departure of precipitation vs temperature for an areal averaged Iowa value. Since both axes are range bounds and we are plotting a fourteen day summarized value, the chart tends to show cycling between regime combinations of warm/cool and dry/wet periods. The plot since the beginning of September shows Iowa mostly on the warm side of average, but with both dry and wet periods. Since we are in an active part of a transition season, we would not expect to dwell for too much time in a particular quadrant, but it appears the ongoing El Nino is helping to keep things on the warm side with both wetter and drier than average periods.
Voting:
Good = 11
Bad = 0
Abstain = 1
Voting:
Good = 11
Bad = 0
Abstain = 1

