IEM Daily Feature
Friday, 01 September 2023
Friday, 01 September 2023
Temp Ranges + Precipitation
Posted: 01 Sep 2023 05:30 AM
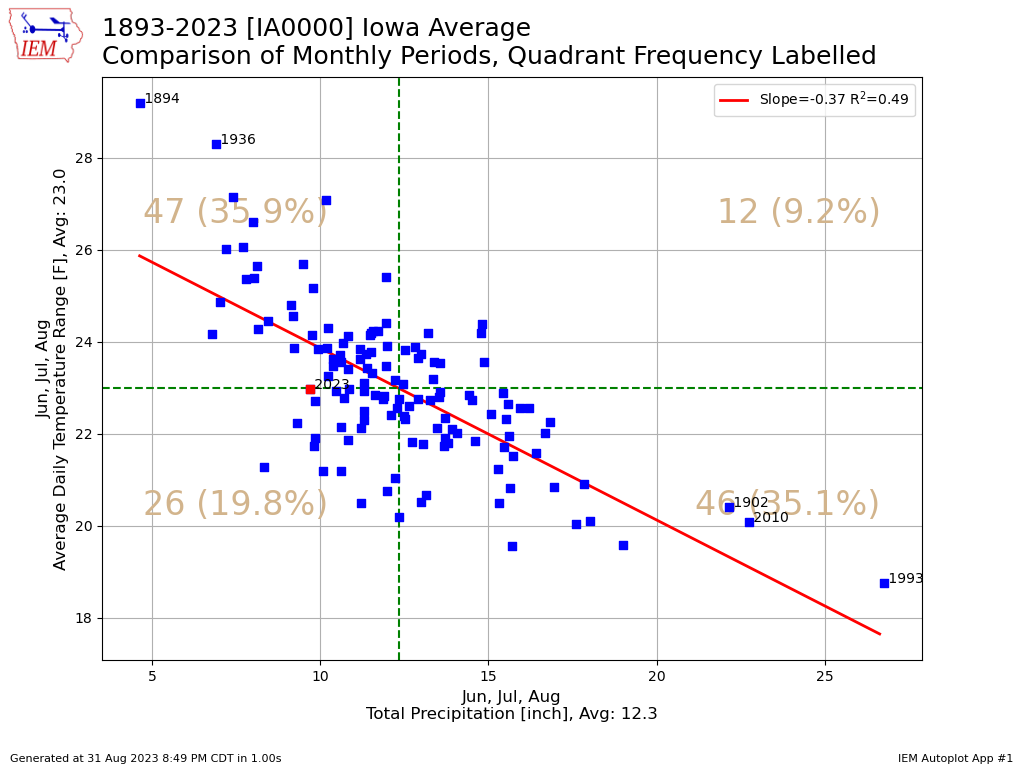
With the three calendar month season of summer in the books, let us compare the season total precipitation with the average range between the daily high and low temperature. The featured chart does just that for an areal averaged value over Iowa. We see a very good and intuitive relationship with increasing precipitation leading to smaller diurnal temperature ranges. The reason for this is that more precipitation likely means more near surface soil water, higher atmospheric humidities, and likely more cloudiness. All of these factors will dampen heating during the day and cooling during the night time, leading to smaller ranges between the daily high and low temperature. The five most extreme years are labelled on the chart along with the 2023 value, which is obscured in the cluster of dots. It is always fun to see intuitive relationships show up in observational datasets! You can generate this chart for other variables of your choice and for months of your choice.
Voting:
Good = 14
Bad = 0
Voting:
Good = 14
Bad = 0