IEM Daily Feature
Monday, 10 July 2023
Monday, 10 July 2023
July Precip Trends
Posted: 10 Jul 2023 05:30 AM
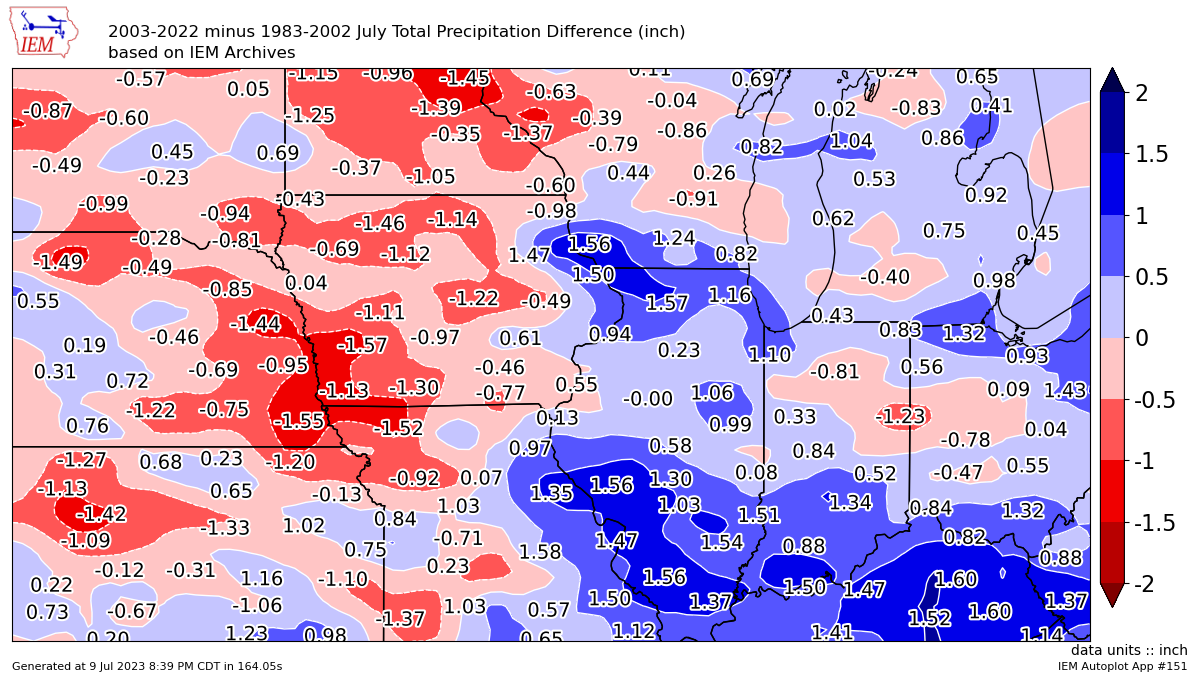
The featured map compares twenty year precipitation totals during the month of July between the past
twenty years and the twenty years prior to that. An interesting spatial pattern is shown with a decrease
is precipitation over the western Corn Belt and mostly an increase over the eastern section. A note of
caution as a twenty year period is a bit short and leads to individual extreme years like 1993 skewing
results. That aside, the regional see saw action will be interesting to watch in the coming years to see if
it continues to trend in that direction.
Voting:
Good = 16
Bad = 0
Voting:
Good = 16
Bad = 0

