IEM Daily Feature
Monday, 03 July 2023
Monday, 03 July 2023
Intense Precip Rates
Posted: 03 Jul 2023 05:30 AM
It was another weekend with rain frequenting the state and much of southern Iowa fared very well.
Some locations experienced very intense rainfall events with slow moving storms and an atmosphere
loaded with water vapor helping to produce those totals. This is the favored time of the year for such
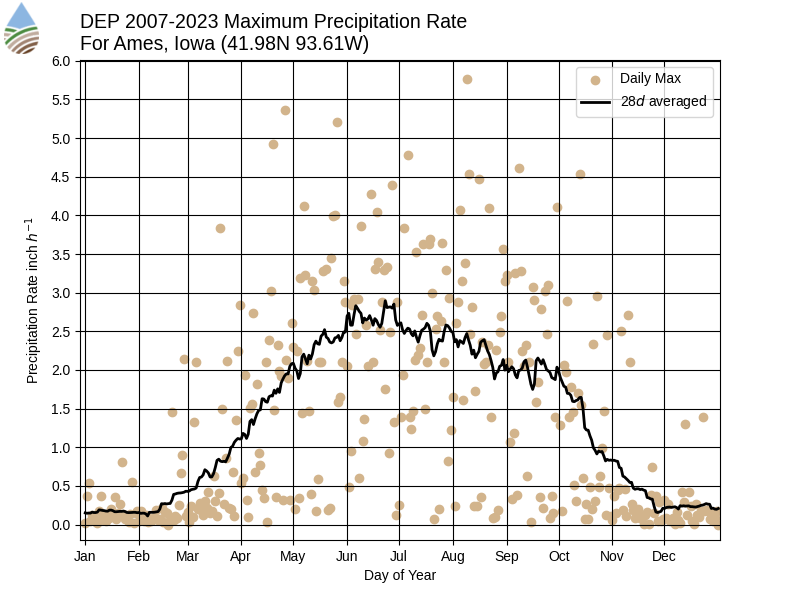
intense rainfall events as shown by the featured chart. The chart presents an analysis of the rainfall
product driving soil erosion estimates within the Daily Erosion Project between 2007 and 2003 for a
location near Ames. This product is based on NOAA RADAR-based estimates along with some gauge
quality control. They are peak precipitation rates over two to five minutes of time, so they are not an
actual hourly precipitation total. The tan dots show the daily maximum values over this period and the
black line is a four week centered smooth to remove some of the noise. The difference between the
cold and warm season is readily apparent as rainfall rates are a function of the water holding capacity
of the atmosphere and warmer air temperatures can hold more water. It is interesting to see the abrupt
drop during October, which is likely being driven by the loss of plant transpiration and thus an important
moisture source to the atmosphere.
Voting:
Good = 9
Bad = 0
Tags: precip
Voting:
Good = 9
Bad = 0
Tags: precip

