IEM Daily Feature
Monday, 27 February 2023
Monday, 27 February 2023
2022 Corn Yield Departures
Posted: 27 Feb 2023 05:30 AM
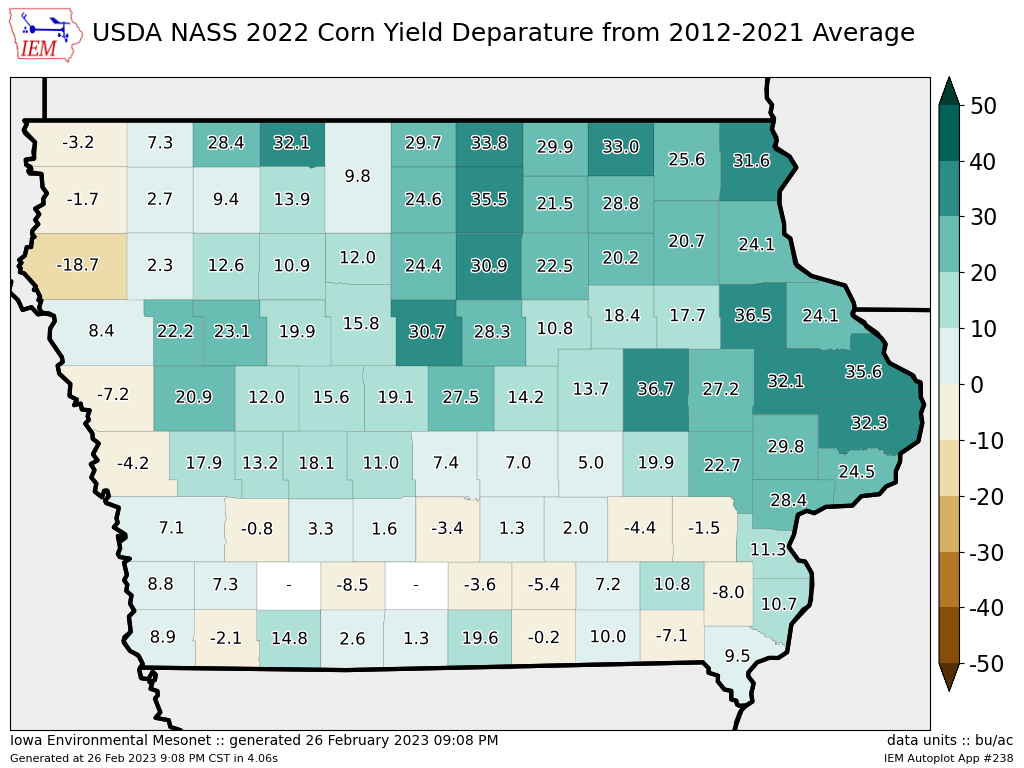
The USDA National Agricultural Statistics Service (NASS) released their county level 2022 yield
estimates on Friday. The featured map presents an IEM computed corn yield departure of the 2022
value from a simple average over the ten most recent years. A negative value would indicate a yield
that was below the past ten year average. The varying impacts of the 2022 drought are generally
reflected in this map with most negative numbers found over southern Iowa and far western Iowa. It is
rather interesting to see the variability shown over northwestern Iowa. Drought conditions were highly
variable in this area as well. It wasn't as if the drought of 2022 featured no rainfall over large chunks of
the state over large number of days, instead rainfalls were fickle and some fields got just enough and
timely rainfalls to make a good crop, while others nearby were not so lucky. You can generate this map
for big drought years like 2012 and you will see a remarkable difference in impact.
Voting:
Good = 12
Bad = 1
Abstain = 1
Voting:
Good = 12
Bad = 1
Abstain = 1

