IEM Daily Feature
Wednesday, 26 October 2022
Wednesday, 26 October 2022
60 Day SPI Changes
Posted: 26 Oct 2022 05:30 AM
The folks that author the US Drought Monitor will take into consideration changes to statistics like the
Standardized Precipitation Index over the past seven days. A question currently being considered is
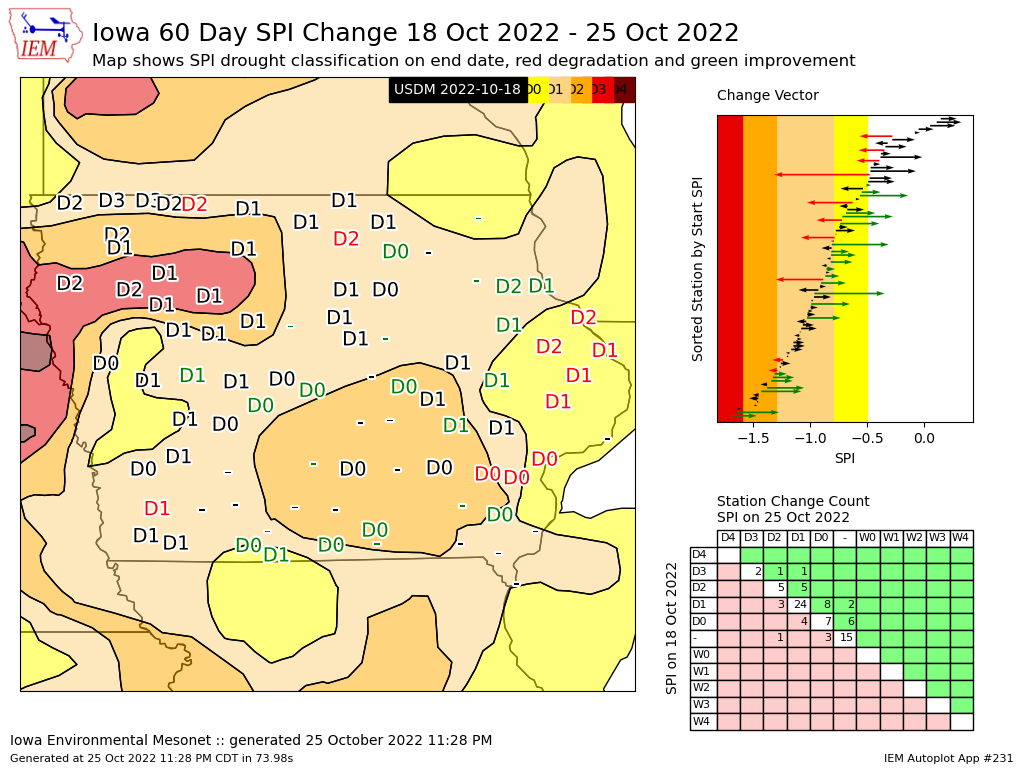
how impactful was the rainfall event this past weekend. The featured graphic is a rather complex data
dive at this question and looks specifically at the 60 day SPI changes from last week to this week. The
map panel presents the combination of most recent drought analysis and 60 day SPI based drought
classification on 25 Oct 2022. Please note that there is not a one to one relationship between any
given SPI value and the US Drought Monitor, the SPI is just an indicator. The plotted map values are
colorized by if that value improved or degraded over the past week. The top right panel shows the
magnitude of change and colored by if that change moved to a different drought classification. The
bottom right panel counts the number of stations that changed from one classification to another. So
this graphic shows that at the 60 day interval, the most recent rain did help some limited areas of the
state, but other areas like far eastern Iowa did not improve.
Voting:
Good = 10
Bad = 0
Voting:
Good = 10
Bad = 0

