IEM Daily Feature
Monday, 19 July 2021
Monday, 19 July 2021
July Precip Climatology
Posted: 19 Jul 2021 05:33 AM
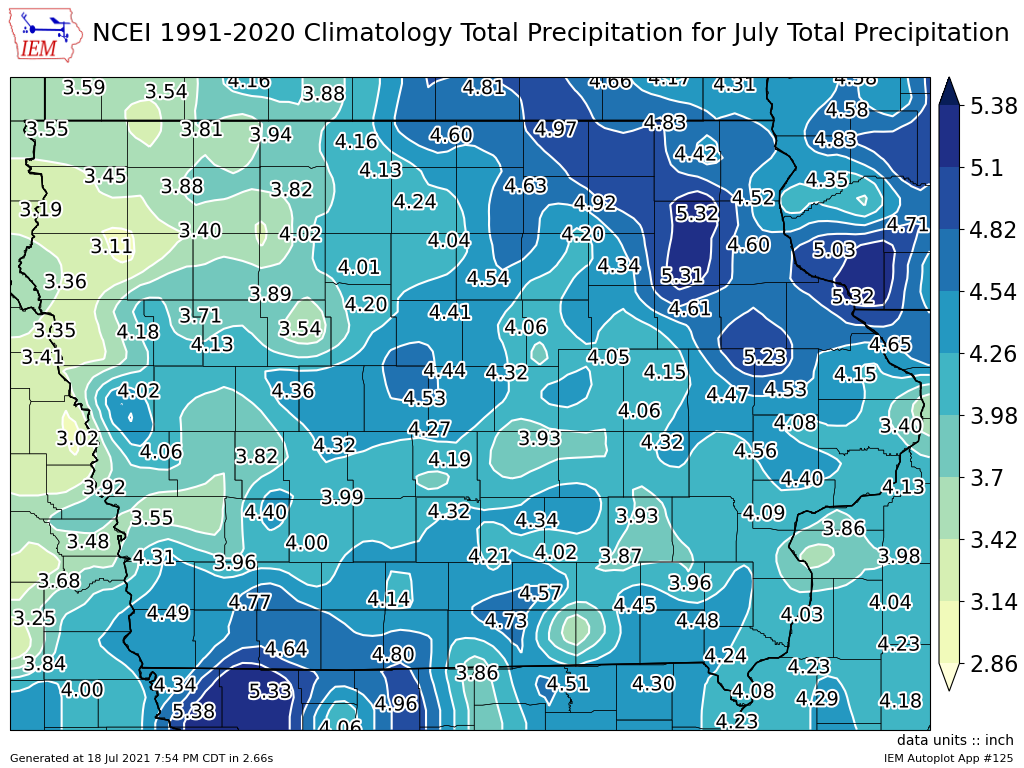
The featured map presents an analysis of total precipitation based on the NCEI daily accumulated
precipitation climatology for July. The map shows a remarkable amount of variability with amounts
over five inches found over northeastern Iowa and values closer to three inches found over
northwestern Iowa. Climatologies computed at this short of time scale (30 years) and for a short
duration of days (just a month) tend to be a bit noisy as individual wet/dry years of the recent past
can heavily influence the averages. Actual rainfall totals this July have been hit or miss with about
everyone now missing out with a dry week ahead and increasingly warm temperatures.
Voting:
Good = 12
Bad = 0
Voting:
Good = 12
Bad = 0

