IEM Daily Feature
Thursday, 15 July 2021
Thursday, 15 July 2021
5,000th IEM Daily Feature!
Posted: 15 Jul 2021 05:38 AM
Today's IEM Daily Feature is the 5,000th in the series dating back to 4 Feb 2002! The initial purpose
of the feature was to drive daily web traffic to the website by highlighting something hopefully current
and interesting related to Iowa's weather and climate. That is still generally the purpose today, but it
has evolved more to provide a gateway into citizen and reproducible science. The featured content is
often direct linked into an "autoplot" application, which allows for further exploration, raw data
download, and customization of plot parameters and location covered. For example, yesterday's
chart was a plot of July dew point distributions for Des Moines. An interested person might wish to
either download that data for further analysis or look at a different month or look at a different location
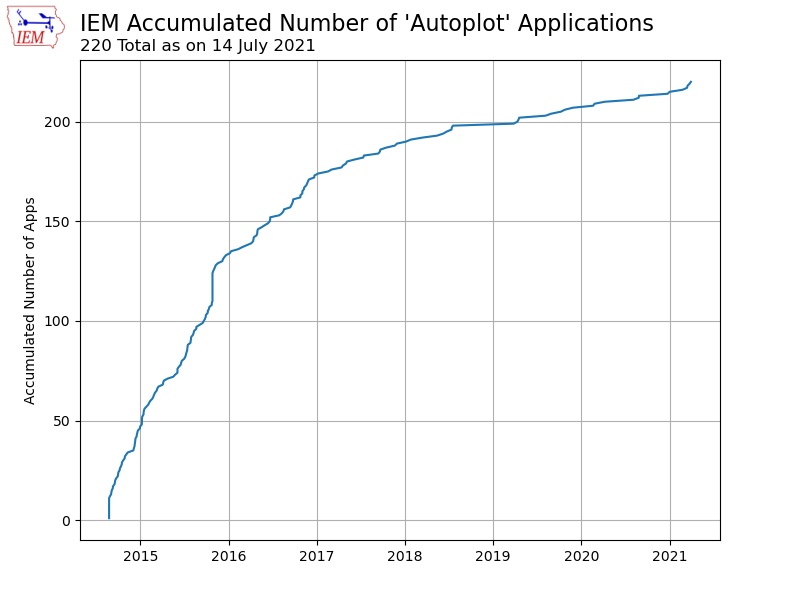
to continue the topic introduced by the feature. The featured chart today doesn't do any of the above,
but just plots the accumulation of 'autoplot' applications on this website. The plot is humorous to me
as I was about to "draw the line" at 200 total applications being enough, but then have been back to
adding more as ideas are offered or needs identified. Anyway, I continue to enjoy writing these and
thanks for your readership!
Voting:
Good = 15
Bad = 1
Tags: iem
Voting:
Good = 15
Bad = 1
Tags: iem

