IEM Daily Feature
Thursday, 03 June 2021
Thursday, 03 June 2021
Spring Season Dew Points
Posted: 03 Jun 2021 05:34 AM
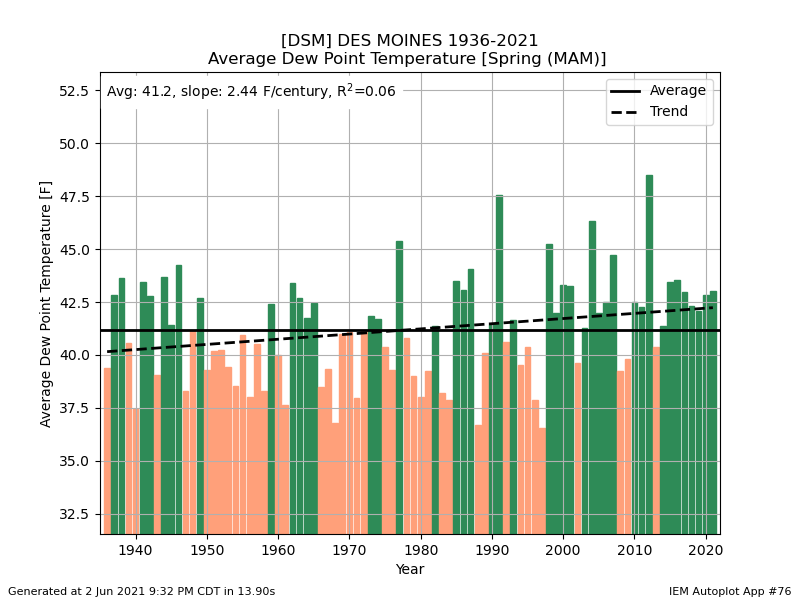
With the recent conclusion of the meteorological spring season (months of March, April, and May), it
is a good time to check in on some metrics for how it compares with previous years. The featured
chart presents a season averaged dew point based on hourly reports for Des Moines with a long
term average and simple linear trend line fit to the data. The average dew point is computed by
averaging all the mixing ratio observations and then computing a dew point from it. Over the past 24
years, only four of those years have a value below long term average. Even with the dry weather and
cool temperatures this spring, it is interesting to see this year's value close to recent years.
Voting:
Good = 14
Bad = 0
Voting:
Good = 14
Bad = 0