IEM Daily Feature
Friday, 12 June 2020
Friday, 12 June 2020
One Big Rain Event
Posted: 12 Jun 2020 04:21 AM
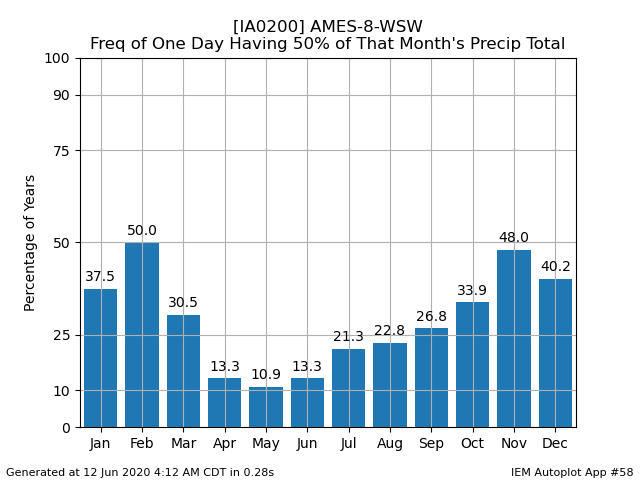
The featured chart looks at the frequency of having one day's precipitation total contributing at least
50% to the monthly total. The frequencies increase during the colder half of the year with the lowest
frequency shown in May. That may seem counter-intuitive as our heaviest rainfall events happen
during the warm half of the season. A simple explanation is that the average monthly total
precipitation values are much lower during the colder half of the year, which makes it "easier" for one
anomalously high daily event to exceed 50% of that month's total. Additionally, heavy rainfall events
are more frequent during the warm season, so it is less likely a given month has only one such event.
Voting:
Good = 15
Bad = 0
Voting:
Good = 15
Bad = 0