Drought Monitor Changes
Posted:
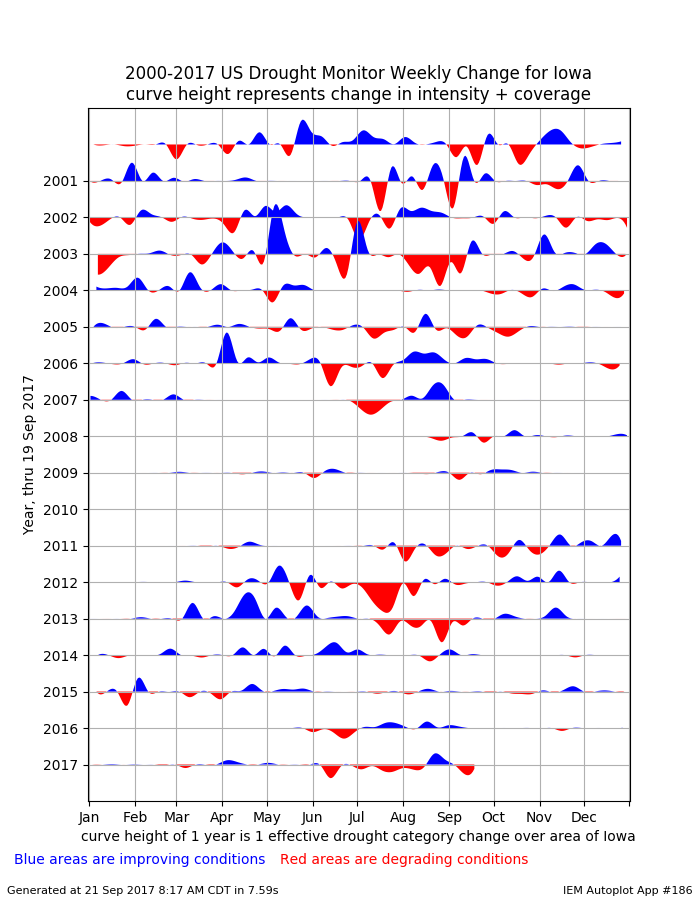
The weekly update to the US Drought Monitor was released this morning. The featured
chart looks at the weekly change in drought coverage over Iowa since the product archive
began in 2000. The height of the curves are a bit complex to explain and the y-axis units
are being conflated with a value of 1 representing the area of the state improving or
degrading one drought category. The bottom series represents this year and you can see
that most of this summer has featured degrading conditions with only some improvement in
August with some much needed rains falling over western Iowa.
Voting:
Good = 9
Bad = 0
Voting:
Good = 9
Bad = 0
