IEM Daily Feature
Thursday, 03 August 2017
Thursday, 03 August 2017
Smallest Day to Day Changes
Posted: 03 Aug 2017 05:33 AM
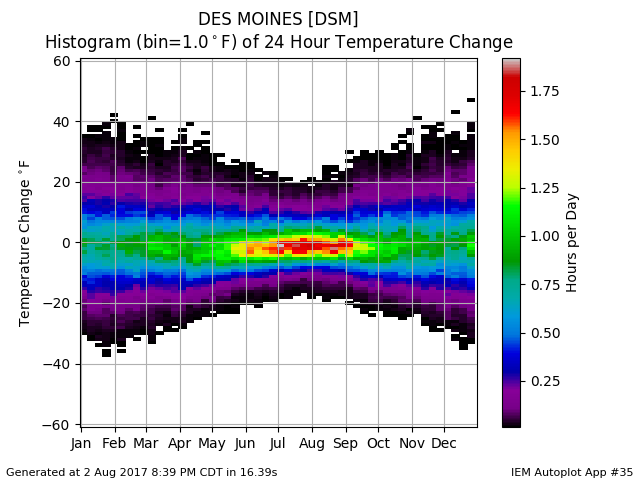
The featured chart displays a histogram of 24 hour temperature changes based on hourly
observations. It is interesting to note that the variability expressed in this chart is minimized
about this time of the year. Rewording, this is the most likely time of year that the
temperature in 24 hours is close to the current temperature. The weather this week mostly
resembles this statement with pleasant highs and cooler overnight lows.
Voting:
Good = 11
Bad = 0
Voting:
Good = 11
Bad = 0

