IEM Daily Feature
Wednesday, 31 May 2017
Wednesday, 31 May 2017
Wet Wisconsin
Posted: 31 May 2017 05:34 AM
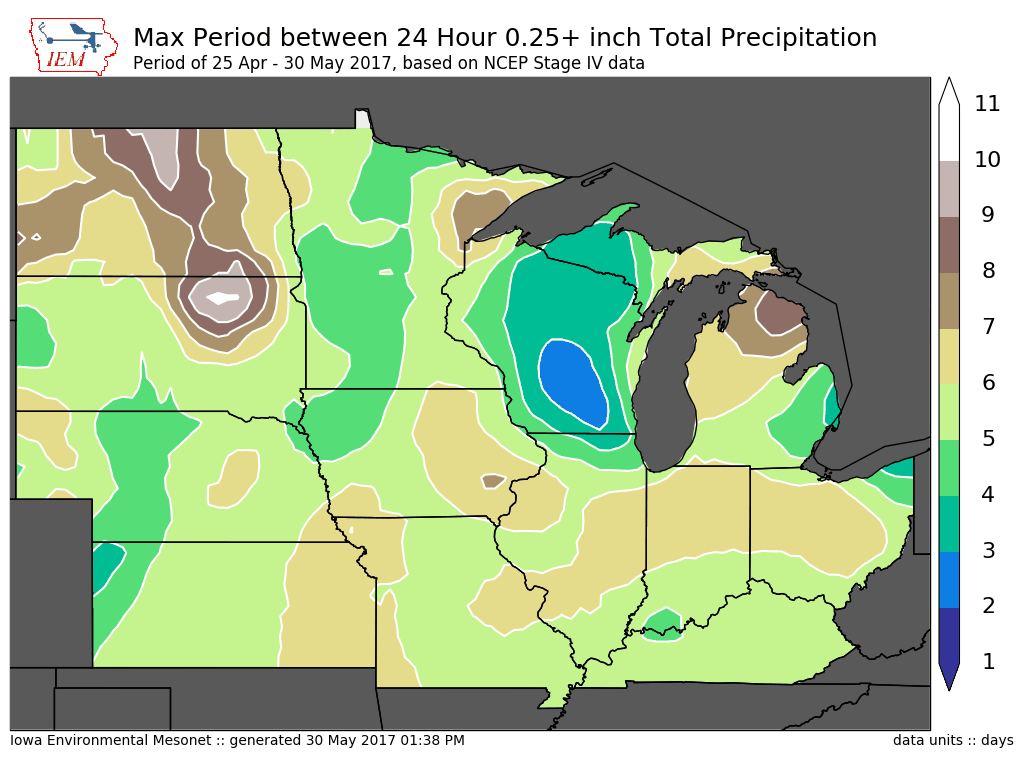
The featured map is an analysis of the maximum period between 24 hour precipitation
totals of 0.25 inch since the 25th of April. This plot is an attempt to assess the maximum
period during this period of days that conditions were "dry". The plot is smoothed and
shows an interesting pattern over the Midwest US. This map places much of Wisconsin in
the two to four day range, meaning the longest period over the past 36 days that the area
went without picking up 0.25+ inches of precipitation was just two to four days. Iowa is
shown in the four to seven day range and longer totals exist over North and South Dakota.
These limited short periods of dry weather have made planting progress slow considerably.
Voting:
Good = 8
Bad = 0
Voting:
Good = 8
Bad = 0

