IEM Daily Feature
Monday, 28 November 2016
Monday, 28 November 2016
Pressure Time Series
Posted: 28 Nov 2016 05:34 AM
It was a windy trip back from Grandma's house for Thanksgiving on Sunday. We are well
into the fall season and strong passing low pressure systems help to drive strong winds as
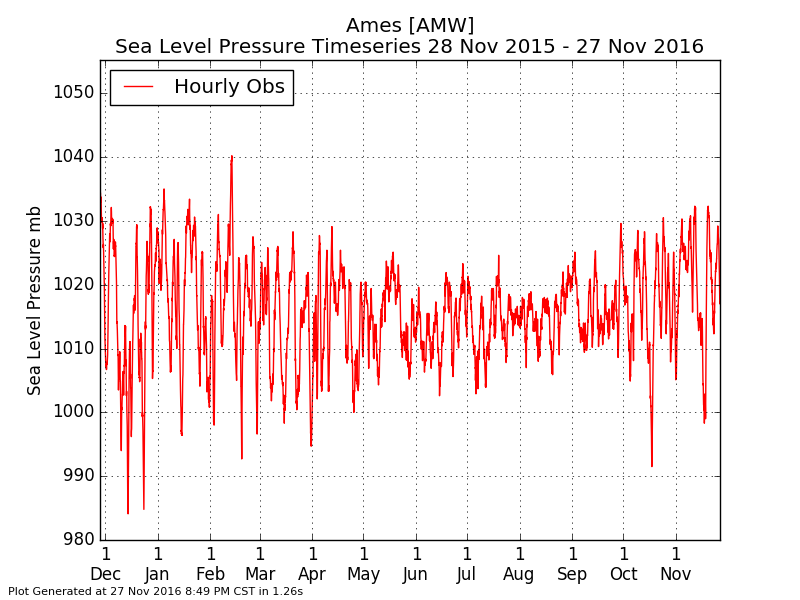
was the case on Sunday. The featured chart displays a time series of sea level pressure
observations from the Ames Airport for the past year. The plot nicely shows the change in
variability of this atmospheric variable between the cold and warm half of the year. The
increased variability during the cold season are due to the stronger storm systems and air
masses. The absence of these during the summer months lead to the less variable
pressure readings.
Voting:
Good = 10
Bad = 0
Abstain = 1
Voting:
Good = 10
Bad = 0
Abstain = 1

