IEM Daily Feature
Thursday, 30 June 2016
Thursday, 30 June 2016
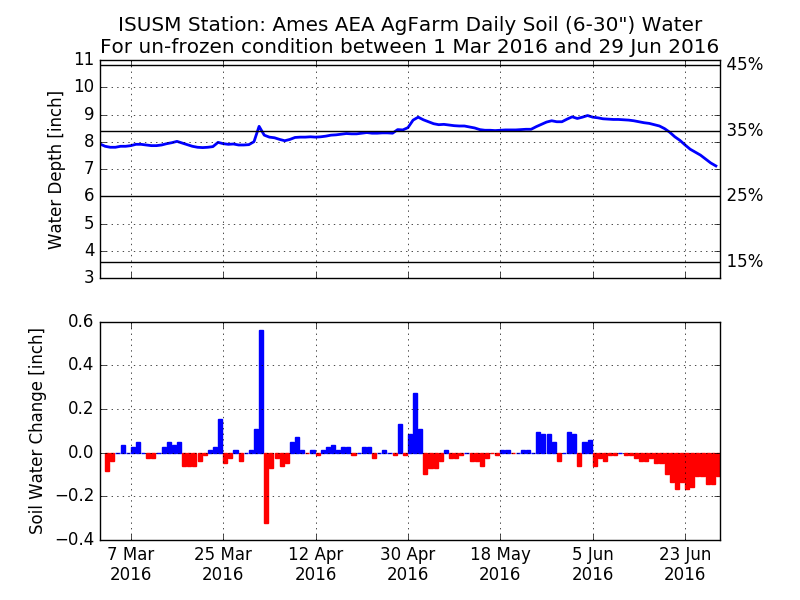
Soil Water Changes
Posted: 30 Jun 2016 05:35 AM
The featured chart displays some computed soil water metrics from the ISU Soil Moisture
Network station near Ames. Assuming that the 12 and 24 inch depth measurement
represents a 12 inch layer of soil each, the volumetric soil water measurement is converted
into a daily depth of water (top chart). The day to day difference for this depth is presented
in the bottom chart. The red bars represent a loss of water and blue bars are a gain.
These sensors are under a growing crop, so the recent negative values in June are likely
due to plant roots transporting the water up to the leaves. Of concern with the lack of
precipitation this month in parts of Iowa is the exhaustion of soil water, which for the
purposes of this plot is not when the water depth reaches zero, but the wilting point of the
soil likely in the 15-20% range.
Voting:
Good = 9
Bad = 1
Tags: soilwater
Voting:
Good = 9
Bad = 1
Tags: soilwater

