IEM Daily Feature
Friday, 21 August 2015
Friday, 21 August 2015
Small Precip Biases
Posted: 21 Aug 2015 05:38 AM
Last week, a featured plot presented the bias associated with computing 24 hour high and
low temperature by hour of the day. Today's feature does the same analysis, but with
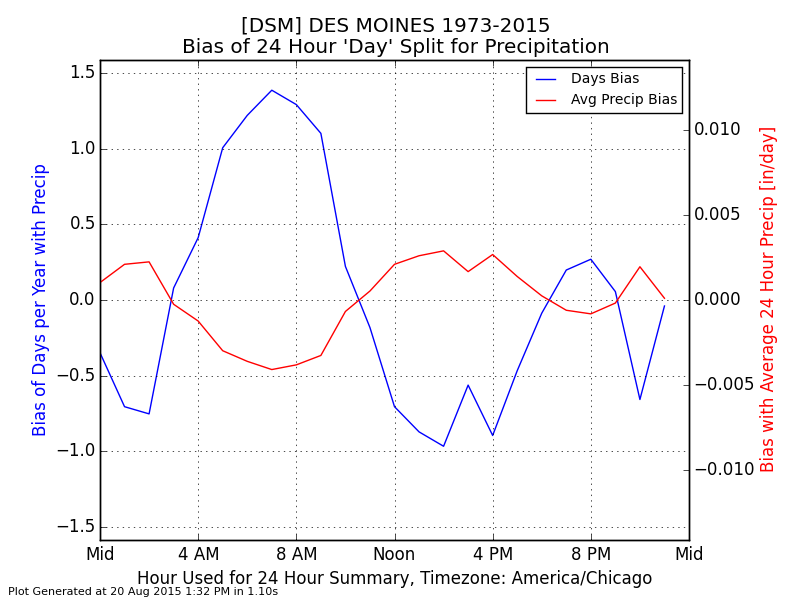
precipitation totals. The biases with precip are very small due to the nature of
accumulating precip over the 24 hour period, which is a conserved amount when
aggregated over time. The chart displays the bias with the total number of 24 hour periods
with precip for the year ("rainy days") and the average 24 hour precip total when there is
precip that day. The peak with number of 'days' is interesting at around 7 AM and 7 PM,
the interpretation is that these are common hours for precip, so it is likely that the next hour
will be precip as well. So splitting the day at that hour, will spill precip into a second 'day'.
The values shown are small regardless, so the differences are likely negligible!
Voting:
Good = 24
Bad = 14
Abstain = 14
Tags: precip
Voting:
Good = 24
Bad = 14
Abstain = 14
Tags: precip

