IEM Daily Feature
Friday, 12 June 2015
Friday, 12 June 2015
Highest Rain Accumulations
Posted: 12 Jun 2015 05:46 AM
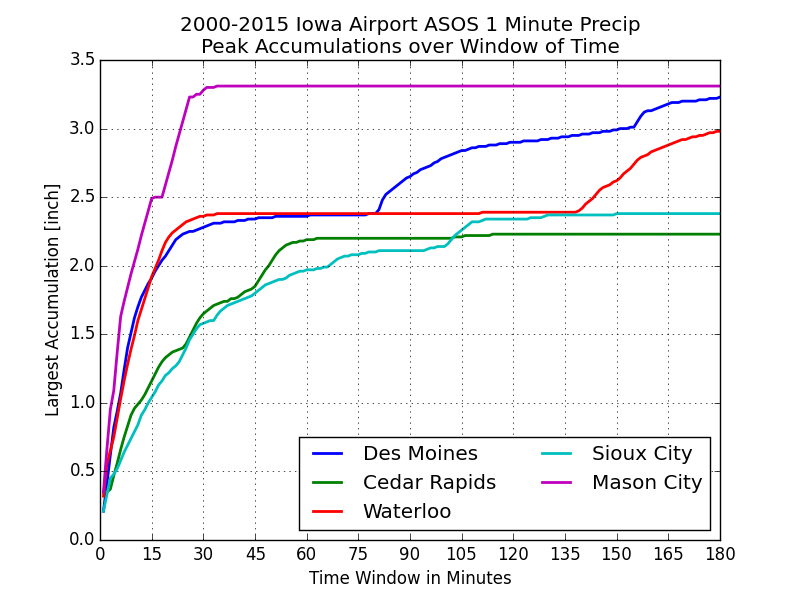
The ASOS weather stations in the state record precipitation at one minute intervals. With
this data, the featured chart presents the highest rainfall accumulation over a given number
of minutes. This chart is useful from an engineering perspective as various structures are
designed to handle a certain amount of water over a certain amount of time. There are
numerous caveats to this chart including the fact that automated sensors struggle to
accurately record these intense rates and the ASOS station includes an upward adjustment
when rainfall rates get this high to account for under-catch. Having said all that, the chart
does nicely illustrate the duration of the most intense thunderstorms. Since we are not
situated against a mountain, storms have to move to maintain a source of energy, so the
most rates are generally done within 30 minutes or so. Having sequential thunderstorms of
this intensity is not going to happen as the atmosphere can not 'refill' its supply of water
that quickly without the help of a mountain. There are some differences between the five
sites plotted, but the differences are likely due to sensor / siting differences and not a
physical explanation (perhaps). There is also only 15 years of data comprising this chart,
so the sample size is a bit small.
Voting:
Good = 36
Bad = 24
Abstain = 22
Tags: precip rates
Voting:
Good = 36
Bad = 24
Abstain = 22
Tags: precip rates

