IEM Daily Feature
Thursday, 16 October 2014
Thursday, 16 October 2014
To Date Ranks
Posted: 16 Oct 2014 05:42 AM
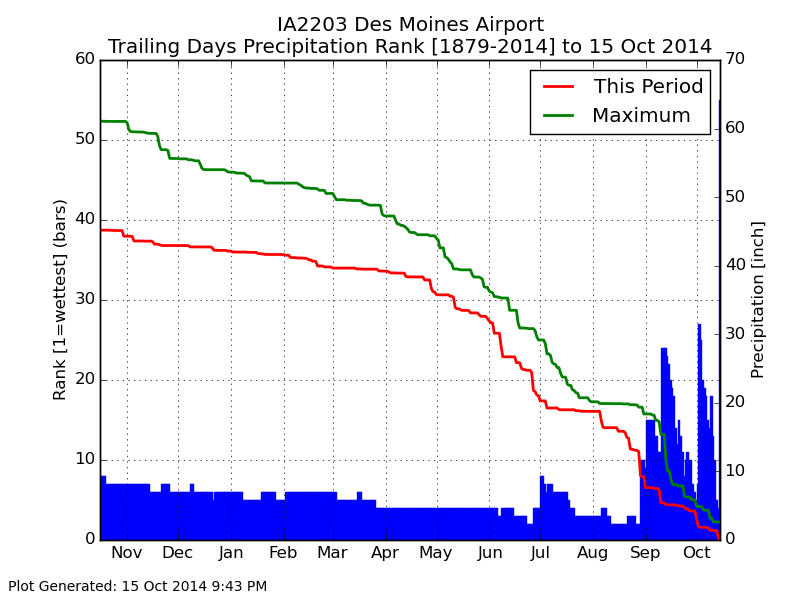
The featured chart displays the to date ranks of accumulated precipitation for intervals
from 1 to 366 days prior to 15 October 2014 for Des Moines. The x-axis goes from right to
left as each bar presents the respective rank for the number of days prior to yesterday.
The chart shows how wet it has been this past year with most the ranks safely in the top
10. The lines on the chart represent the actual accumulations (red line) and the maximum
on record (green line). Thankfully, we have dry weather in the forecast, so our rankings
won't go any lower!
Voting:
Good = 8
Bad = 12
Abstain = 8
Voting:
Good = 8
Bad = 12
Abstain = 8