IEM Daily Feature
Wednesday, 02 January 2013
Wednesday, 02 January 2013
Missing Precipitation
Posted: 02 Jan 2013 05:35 AM
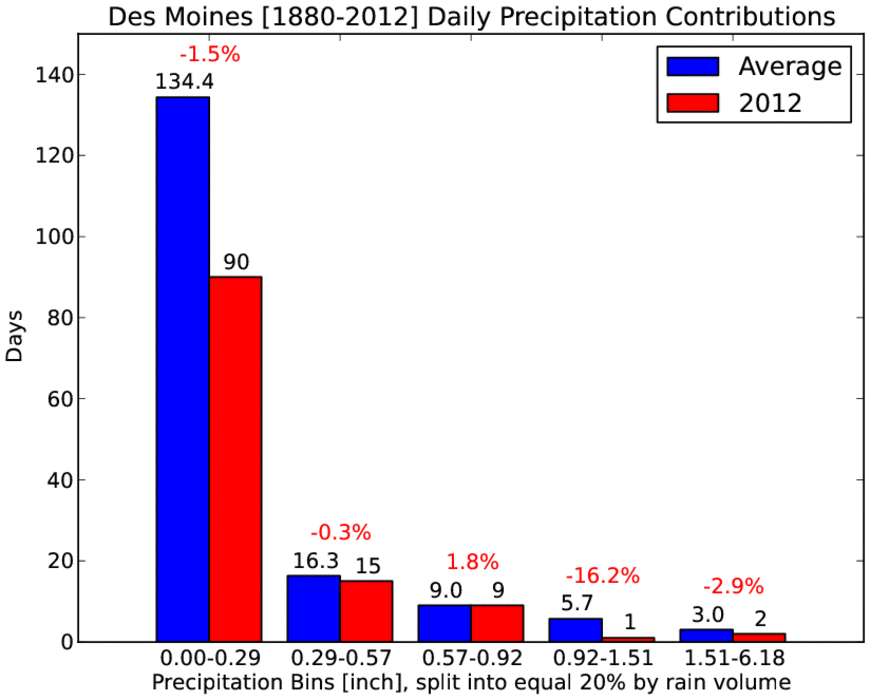
The featured chart attempts to answer the question of what was missing
from the precipitation for Des Moines during 2012. The chart divides
up
the daily precipitation totals into 5 bins that over the long term have
each contributed 20% of the total. For example, the first bin of 0 to
0.29 inches on average provide 20% of the yearly total over an average
of
134 days. On the high end, there are an average of 3 events of over
1.51
inches providing another 20%. The red bars are what was observed in
2012
along with the contribution to the departure this year in red text.
One
category clearly dominates and that was a lack of events between 0.92
and
1.51 inches. While the difference in days at the lowest bin looks
significant, the actual departure of total rainfall was marginal.
Voting:
Good = 25
Bad = 3
Tags: precip
Voting:
Good = 25
Bad = 3
Tags: precip

