IEM Daily Feature
Friday, 29 January 2010
Friday, 29 January 2010
Is the worst behind us?
Posted: 29 Jan 2010 06:11 AM
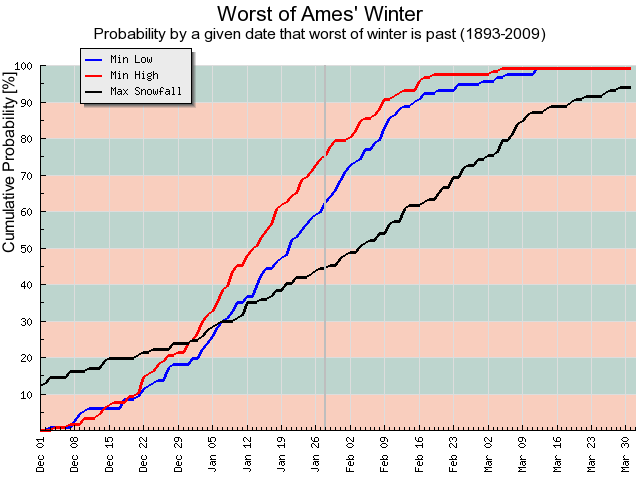
The featured chart looks at the cumulative probability that by a given
date, the min low, min high or maximum snowfall has occurred for the
winter season. For example, by Jan 28th the lowest high temperature
for the season occurred 75% of the time prior to the date (meaning the
coldest highs are hopefully behind us). It is interesting to note the
slope of the maximum snowfall line and how the current value is around
40%. Big snowfalls are still possible, especially as we transition to
spring (imagine that).
Voting:
Good = 77
Bad = 13
Tags: winter climate
Voting:
Good = 77
Bad = 13
Tags: winter climate

