IEM Daily Feature
Wednesday, 04 February 2009
Wednesday, 04 February 2009
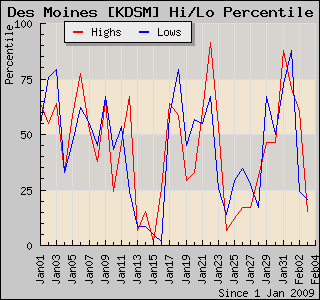
Temperature percentiles
Posted: 04 Feb 2009 06:19 AM
The featured chart is a time series of daily high and low temperature percentiles. Based on historical temperatures, a percentile quickly shows the percentage of observations above and below the actual value for the day. It is effectively a way to rank the observation. The exceptional cold around 15 January sticks out in this plot with a repeat period toward the end of the month.
Voting:
Good = 16
Bad = 6
Tags: percentile
Voting:
Good = 16
Bad = 6
Tags: percentile

