Archived Model Output Statistics (MOS)
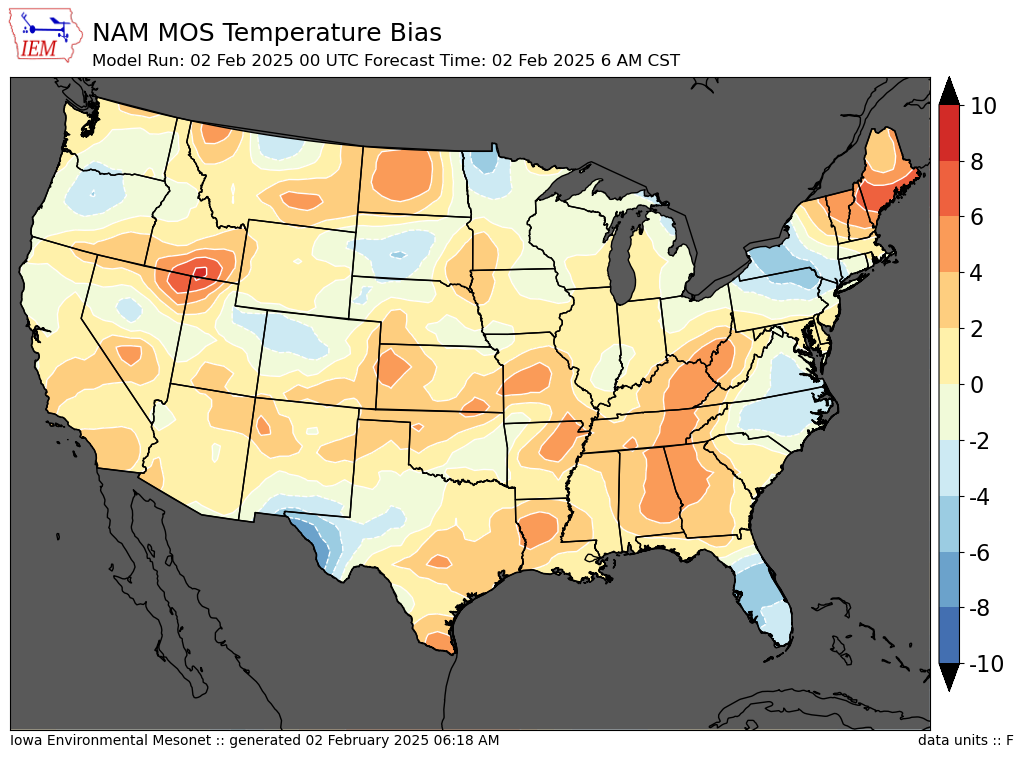
The National Weather Service operates a number of operational weather prediction models. These models produce a gridded forecast that is then processed thru a series of equations (Model Output Statistics) to produce a site specific forecast. You can find out more about MOS on the NWS's website. The IEM maintains an interactive MOS archive to support local research and makes it available for others to use as well.
Archive Status:
| Model | Start | End |
|---|---|---|
| AVN | 1 June 2000 | 16 Dec 2003 |
| ETA | 24 Feb 2002 | 9 Dec 2008 |
| GFS | 16 Dec 2003 | --Realtime-- |
| GFS LAMP (abbr LAV) [0, 6, 12, 18] | 12 Jul 2020 | --Realtime-- |
| GFS Extended (abbr MEX) | 12 Jul 2020 | --Realtime-- |
| NAM | 9 Dec 2008 | --Realtime-- |
| NBS [0, 7, 12, 19z] | 7 Nov 2018 | 25 Feb 2020 |
| NBS [1, 7, 13, 19z] | 26 Feb 2020 | --Realtime-- |
| NBE [1, 7, 13, 19z] | 23 Jul 2020 | --Realtime-- |
The MOS products are processed in realtime and immediately available from the applications listed below.
Current Tools:
- ASCII Data Tables
The raw text-based MOS data comes in collectives with multiple sites found within one product. The IEM splits these and then assigns 6 character AWIPS/AFOS like IDs to them, such that you can easily retrieve the raw ASCII MOS data. The general identifier form is<model><3-char station>. For example,LAVDSMfor GFS LAMP for Des Moines. - Sample link to latest GFS LAMP for KDSM
Please see the discussion above about the identifiers used. This page just provides the text and not much else. Best for if you want to bookmark direct links or do some of your own MOS parsing, gasp. Just adjust thepil=value as you see fit. - Interactive MOS Tables
Generates a simple table of how a variable changes over time and by model run. - Meteogram Generator
Fancy application to generate graphs of current MOS data. - Comma Delimited / JSON output
Simple web service provides csv/json data for one or more sites for a given model and optional runtime. An example URL call would be:
/api/1/mos.txt?station=KAMW&runtime=2009-01-10%2012:00Z&model=GFS  (explicit)
/api/1/mos.txt?station=KAMW&model=GFS  (last available GFS run for Ames in csv)
/api/1/mos.json?station=KAMW&model=GFS  (last available GFS run for Ames in JSON)
/api/1/mos.txt?station=KDSM&station=KAMW&model=GFS  (last available GFS run for Ames and Des Moines)
- Download the raw data!
This application returns the raw MOS data for a location and time period of your choice. - Monthly Plots of Station Temperature Forecasts
This application creates a graph of daily MOS forecasts and actual temperatures for a month and station of your choice.
Note: MOS variables are stored as their raw encodings in the text product, except wdr (wind direction) which is multiplied by 10 for its true value.
Current Plots
Publications Citing IEM Data (View All)
These are the most recent 10 publications that have cited the usage of data from this page. This list is not exhaustive, so please let us know if you have a publication that should be added.
- Lang, V., T. Turner, et al. 2022, Predicting Peak Wind Gusts during Specific Weather Types with the Meteorologically Stratified Gust Factor Model. Weather and Forecasting. Volume 37, Issue 8. https://doi.org/10.1175/WAF-D-21-0201.1
- Turner, T. 2020, PREDICTING PEAK WIND GUSTS DURING SPECIFIC WEATHER TYPES WITH THE METEOROLOGICALLY STRATIFIED GUST FACTOR MODEL. Masters Thesis, University of Wisconsin Milwaukee. ISBN 9798672145709 https://proquest.com/docview/2447557187


