Past IEM Features tagged: winter
The IEM generates per winter storm analyses of snowfall reports over Iowa and tags them by the winter season. Here are the tags used for the previous winter seasons that these maps are available for:
- Winter 2010-2011
- Winter 2011-2012
- Winter 2012-2013
- Winter 2013-2014
- Winter 2014-2015
- Winter 2015-2016
- Winter 2016-2017
- Winter 2017-2018
- Winter 2018-2019
- Winter 2019-2020
- Winter 2020-2021
- Winter 2021-2022
- Winter 2022-2023
- Winter 2023-2024

Warmest Winter *
04 Mar 2024 05:30 AMFor the winter season comprising the months of December thru February and considering an average daily temperature, many sites in the upper Midwestern US had their warmest winter on record. As the feature title denotes, there is a bit of an asterisk to this statement. The asterisk is the consideration of the winter of 1877-1878, which is before the period of record starts for the vast majority of long term climate data for the region. The featured table presents some IEM computed winter season average temperature records for selected sites over the region. The warmest value is highlighted. For a number of sites with data for 1877-1878, that winter was much warmer than our most recently finished one. Minneapolis and Milwaukee are exceptions with this winter warmer than the 1877-1878 one. The official NCEI statewide data starts in 1895, so it may end up showing this winter as the warmest on record for a number of states (including Iowa), but that statistic would not include 1877-1878. Another interesting data point is Bismarck, ND, whose warmest winter was 1930-1931 and that even includes the 1877-1878 one.
Voting:
Good: 17
Bad: 1
Tags: winter 2024

Awaiting Next Step-down
09 Dec 2019 05:34 AMThe featured chart presents the year to date minimum low temperature for Ames. The chart shows this year's value along with the climatology of such an accumulated value. The very cold temperature below zero during mid November dropped the value well below climatology, but we have yet to breach that level since and so attrition has us back near the the inter-quartile range for the second week of December. Colder air will drop temperatures during Monday, but nothing sub zero is expected. The chart nicely shows that climatology for this metric creeps downward until about mid February, so we will likely see colder temperatures yet sometime this winter season.
Voting:
Good: 13
Bad: 0
Tags: winter
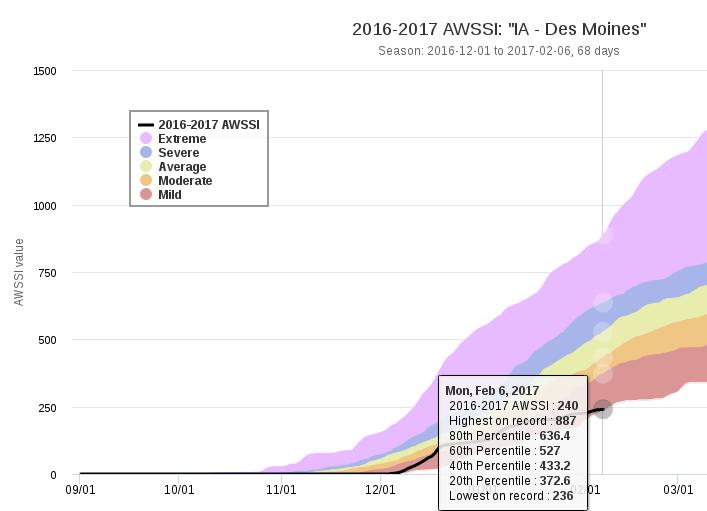
Near lowest AWSSI for Des Moines
08 Feb 2017 05:39 AMThe Accumulated Winter Season Severity Index (AWSSI) is some ongoing research lead by Barbara Mayes Boustead of NWS Omaha that attempts to quantify and compare the severity of the winter season. It takes into account daily temperatures, snow depth, and snowfall. The higher the index value implies a more severe winter season. The featured chart is from the AWSSI website and shows the total this year for Des Moines near the lowest accumulation to date on record for the site.
Voting:
Good: 12
Bad: 0
Abstain: 1
Tags: winter awssi

Winter Frozen Days
04 Mar 2016 05:11 AMTemperatures were a bit chilly on Thursday with highs only in the 30s for much of the state and only extreme southwestern Iowa enjoyed the 40s. The featured chart displays the number of days each winter season (December thru February) that the high temperature was below 32 degrees (a frozen day). The total this year for Ames continues the recent trend of below long term average seasonal totals. The current forecast is optimistic for a warm up next week with highs in the 50s and even higher.
Voting:
Good: 39
Bad: 23
Abstain: 25
Tags: winter

All Winter below 50 Degrees
13 Feb 2015 05:50 AMThe featured map displays the percentage of winter seasons that fail to reach 50 degrees for at least one day that season. There is nothing special about the number 50 for this metric. The map depicts a large contrast over our region with southern locations at or near zero percent (meaning they always see at least one day per winter over 50) and places over Minnesota approaching one hundred percent (every winter is below 50). The climate district averages are plotted, which raises the bar a bit for the threshold to be breached by a number of local weather stations and not just one. It is interesting to note that the gradient is not a flat north to south one, but tilts as you approach the high plains. The proximity to the mountains helps those locations warm quickly as down slope wind events drive rapid warm ups.
Voting:
Good: 40
Bad: 21
Abstain: 18
Tags: winter
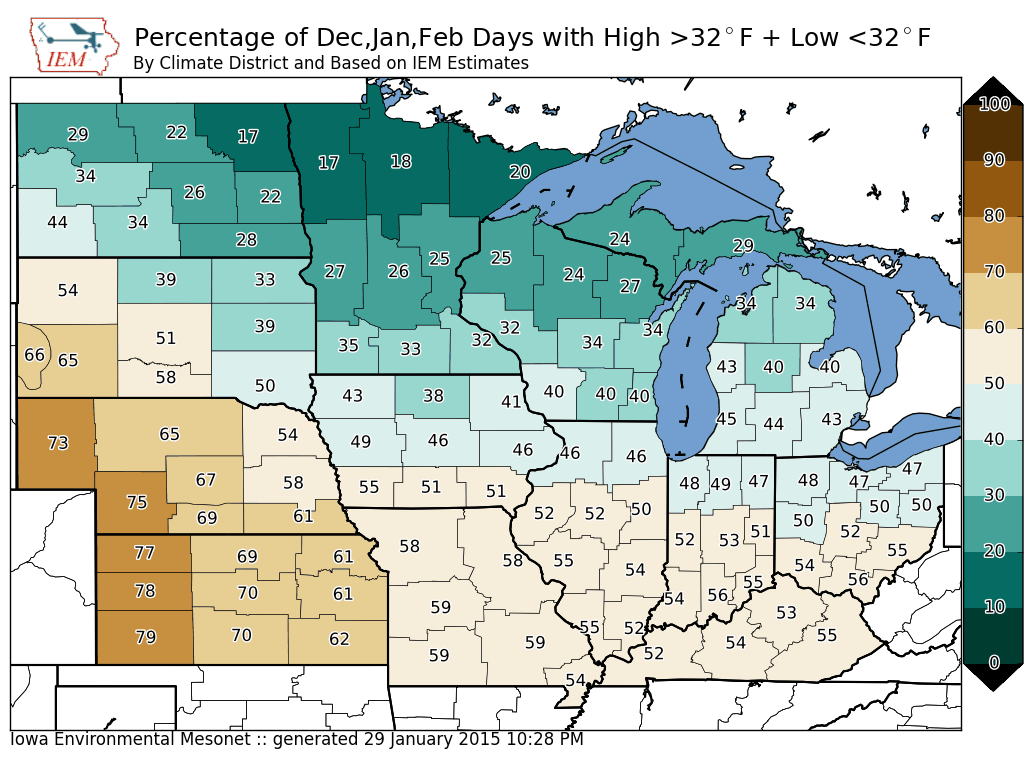
Above and Below Freezing
30 Jan 2015 05:45 AMToday's featured map presents the frequency of having a daily high temperature above freezing with the daily low temperature being below freezing for the winter months of December, January and February. Yesterday's feature showed that just about half of Iowa's winter days have a high temperature above freezing. This map shows slightly smaller values, but again about half of winter days have a high above freezing with a low below freezing. The largest frequencies are shown over western Nebraska and Kansas with just under 80% of days meeting this criteria.
Voting:
Good: 31
Bad: 13
Abstain: 9
Tags: winter

Winter Highs Above Freezing
29 Jan 2015 05:58 AMOur recent stretch of January weather has seen very pleasant temperatures for most of Iowa. Some consider winter as a constantly frozen and harsh time in the midwest and it is certainly like that at times, but the featured map shows that on average, high temperatures are often above freezing for the period of December to February. A considerable gradient exists in the midwest with frequencies dropping by about ten percentage points for every climate district you travel north. The forecast has a return to daily highs below freezing and some chances of snow.
Voting:
Good: 26
Bad: 3
Abstain: 4
Tags: winter
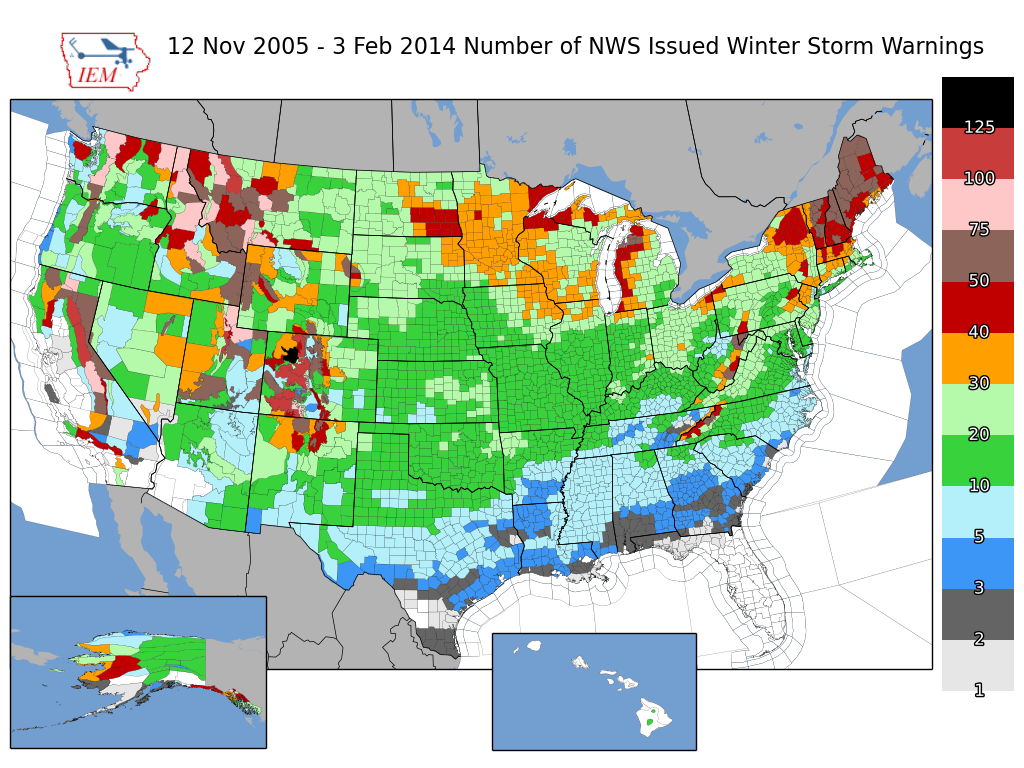
Winter Storm Warnings
04 Feb 2014 05:45 AMThe NWS has a Winter Storm Warning in effect for much of southern Iowa from today into Wednesday morning. The featured map presents the total number of Winter Storm Warnings issued by the NWS since late 2005. Northeastern Iowa has the largest totals in the state with the largest total (130) in the country for Flattops forecast zone in Colorado. Winter Storm Warnings are typically issued for significant snowfall accumulations over a twelve or more hour period. Our snowfalls so far this winter have not been excessive, so the number of warnings issued has been lower than recent average.
Voting:
Good: 61
Bad: 16
Abstain: 8
Tags: nws winter

Coldest of the winter
14 Jan 2014 05:37 AMWas the recent stretch of cold weather, the coldest of the season? The featured chart displays the combination of coldest low and high temperature of the season with the day it occurred on. The lowest temperatures so far this season are shown in red. There is plenty of time for much colder weather and the forecast has a return to colder temperatures, but nothing like what we saw last week.
Voting:
Good: 32
Bad: 7
Abstain: 3
Tags: winter

Back above freezing after low
27 Dec 2013 05:44 AMAfter very cold low temperatures on the 24th, highs the next day were back above freezing! The featured chart presents the frequency of having an above freezing high temperature for at least one of the three days following a day with the given low temperature. A linear relationship exists until temperatures reach negative five or so and then the frequencies flatten out. This would indicate that it does not matter how cold temperatures get once they are below negative five. The physical reasoning for this may be that cooling below this level is a local radiation effect and not indicative of a more intense cold air mass which would decrease the chances of returning to above freezing temperatures in the near term future.
Voting:
Good: 69
Bad: 12
Abstain: 4
Tags: lows winter

Last sub zero temps
24 Dec 2013 05:45 AMA very cold air mass, fresh snow pack, and clear skies are helping temperatures to plummet this Tuesday morning. Lows this morning are below zero Fahrenheit for the entire state with some locations pushing values below negative 20! The featured chart presents the period for Des Moines since the last temperature as cold as the given threshold. This morning's lows would be the coldest since the first week of January back in 2010. The good news is that warmer air is expected for the rest of this week with highs even approaching 30 degrees!
Voting:
Good: 44
Bad: 9
Abstain: 6
Tags: winter lows
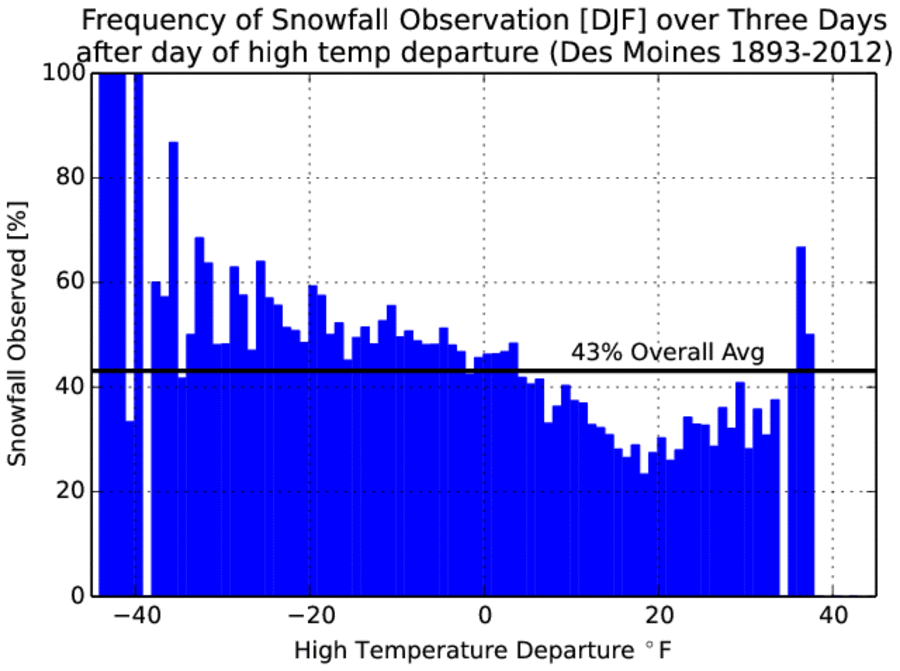
Warmup hurts snow chances
19 Dec 2013 05:38 AMTemperatures warmed very nicely on Wednesday with highs some 15-20 degrees above average for some parts of the state. Are such warm conditions in the winter typically followed by snowfall? The featured chart presents the frequency of having at least one day of measurable snowfall for the three days following a day with the given high temperature departure. These values are only presented for dates during December, January, and February (DJF). A rather smooth signal appears in the chart with the highest frequencies at temperatures below climatology and warmer than average temperatures leading to a decrease in frequency. There appears to be an interesting inflection point around +20 degrees above average whereby frequencies actually increase. This can probably be explained by the most extreme temperature warm ups being associated with intense storm systems that bring colder weather and snow with the cold front passage.
Voting:
Good: 33
Bad: 4
Abstain: 3
Tags: snow winter

Cold Stretches
13 Dec 2013 05:43 AMTemperatures finally returned to reasonable levels on Thursday with some lucky locations in Iowa hitting 30 degrees! This was the warmest it has been in just over seven days. The featured chart looks at the longest period below a given temperature based on hourly temperature data for Des Moines, Sioux Falls, and St Louis. The north - south geography holds with Des Moines experiencing durations in between longer ones for Sioux Falls and shorter ones for St Louis. The current stretch of weather below 31 degrees has many days to go before besting the longest stretch of around 31 days. The forecast calls for warming to above freezing next week.
Voting:
Good: 60
Bad: 11
Abstain: 8
Tags: winter freezing cold

Colder weather to come?
23 Jan 2013 05:39 AMOur recent bout with cold weather was the coldest of the season. Ames reported negative five for a low temperature, which tied the lowest temperature for the season. Is colder weather to come or is this it? The featured chart looks at the coldest temperature of the winter season and the date on which it occurred. There is certainly plenty of time for colder weather to occur and negative five would be one of the warmer temperatures on record for a winter minimum. Selected warm, cold, and March events are labelled on the plot.
Voting:
Good: 19
Bad: 1
Tags: winter
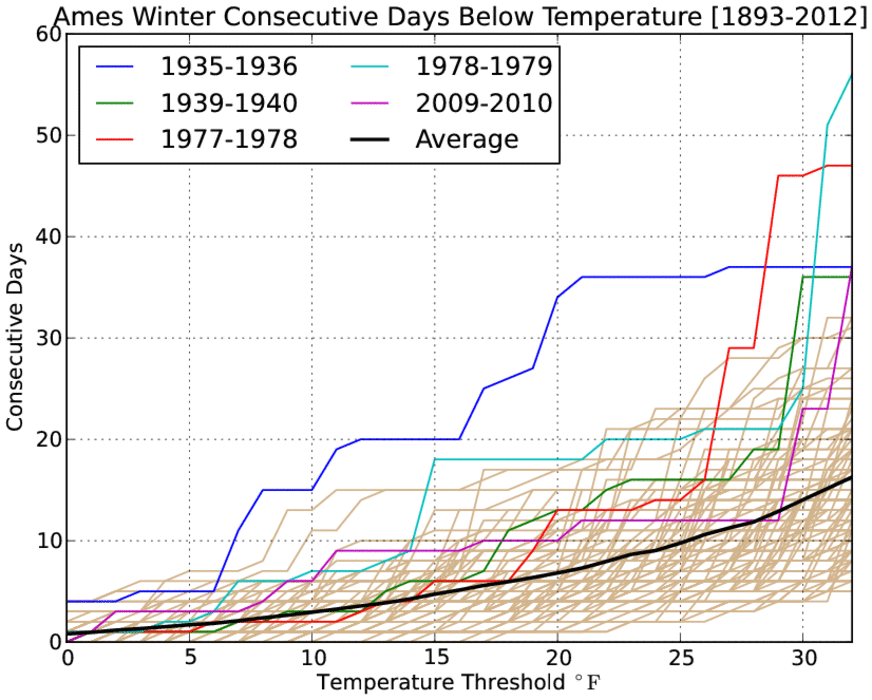
Depth of Winter
18 Jan 2013 05:36 AMWhat makes for a brutal winter season? Perhaps having a streak of days below a certain temperature would qualify. The featured chart presents the longest streak of days below a given temperature for each winter season since 1893. A few of the most brutal years are highlighted along with the simple average of the lines plotted. Our upcoming bout with cold air will be intense, but does not look to persist for very long. The lack of snow cover makes persistent cold difficult to come by.
Voting:
Good: 67
Bad: 21
Tags: winter

Another metric showing a calmer winter
16 Feb 2012 05:47 AMThis winter has certainly seemed more like the other seasons of the year rather than the brutal winters we remember from past years. The featured chart is another metric showing how few winter weather headlines have been issued by the National Weather Service so far this winter as compared with the past six years. The value shown represents the average number of winter weather advisories and warnings per county in Iowa. The values are partitioned each year for before and after 16 Feb periods, so there is still plenty of time for more winter storms.
Voting:
Good: 11
Bad: 0
Tags: winter

Only brief sustained cold
01 Feb 2012 05:57 AMThe featured chart presents the maximum period with temperatures below freezing based on hourly observations for Des Moines. The longest period this year is only a bit longer than three previous years. There is still plenty of winter season to go and as is shown by the bottom chart, there are longest streaks of the season that get started in February and even March. The forecast has been hinting at a return of winter to the state with chances of snow, but temperatures do not look that cold at least to early next week.
Voting:
Good: 13
Bad: 2
Tags: winter freezing
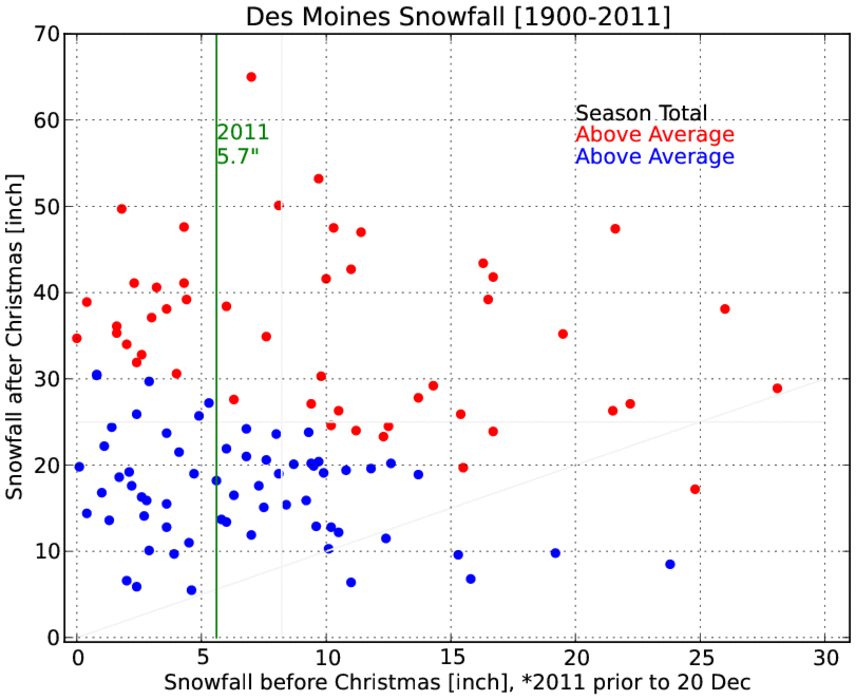
Before and after Christmas
20 Dec 2011 05:56 AMThe featured chart presents a comparison between the accumulated snowfall prior to and after Christmas. Only a handful of winters have seen less snowfall after Christmas than before. The chart also shows that not having much snow prior to 25 December does not limit the amount of snow after with some of the largest totals coming after just a few inches in the first period. Currently, a large winter storm is just to our southwest, but struggling to bring snow into Iowa. The chances for a white Christmas continue to look rather dim.
Voting:
Good: 26
Bad: 3
Tags: winter snow
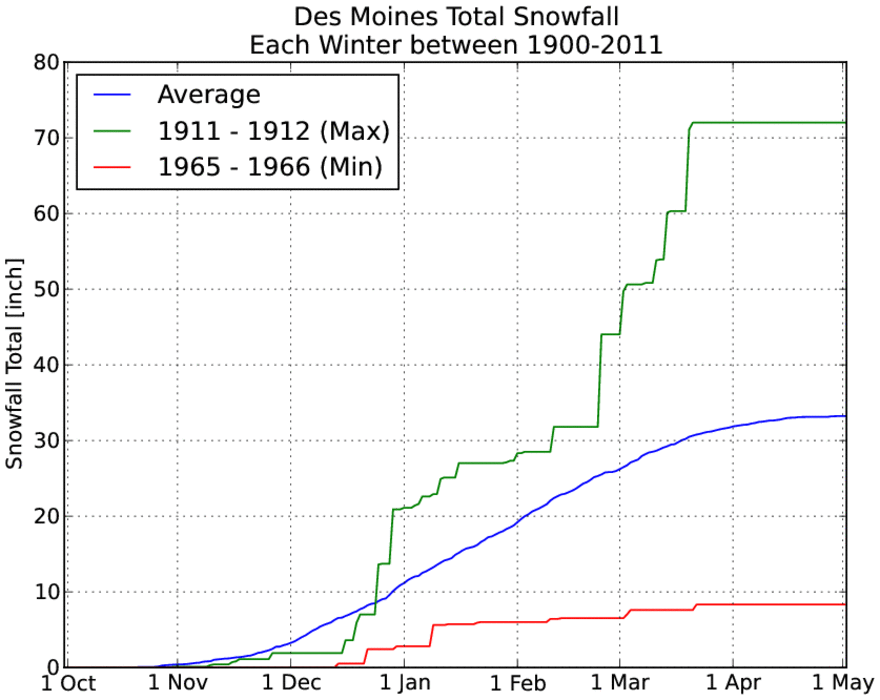
More snow to go
13 Dec 2011 05:56 AMYesterday's feature presented the climatology of the number of winter snow storms. The featured chart today presents the total snowfall for the winter season. The years with the maximum and minimum accumulation are shown as well. For the immediate future, our chances of rain look to be better than snow, but technically it is still the fall season and we have all of the winter season yet to go!
Voting:
Good: 21
Bad: 2
Tags: winter snow

Many storms to go
12 Dec 2011 05:55 AMThe featured chart presents a climatology of winter season snow storms for Des Moines. For this chart, a snow storm is defined as having at least one day with measurable snowfall followed by at least one day without snow. The years with the maximum and minimum number of storms are shown as well. With only a few storms in the books this year, we have plenty more to go.
Voting:
Good: 18
Bad: 4
Tags: winter snow

Frozen Days
06 Dec 2011 05:57 AMAmes experienced its first day with a high temperature below freezing on Sunday. The featured chart presents the number of days each winter with a daily high temperature below freezing along with the first day of winter below freezing. The first day this year is a bit later than normal. The bottom chart hints that having the first frozen day in December typically leads to a below average number of frozen days for the winter season. If this were to happen, it would buck the recent trend shown in the middle figure of having above average number of days per year with a high temperature below freezing.
Voting:
Good: 14
Bad: 3
Tags: frozen winter

The slide into winter
18 Nov 2011 05:57 AMThursday morning saw our coldest temperatures of the season with lows approaching zero degrees in far northwest Iowa. The featured chart presents the average first date of occurrence for a given temperature for four sites in Iowa. It is interesting to see how much closer Ames is to Sioux City than Des Moines. Davenport's climatology is about two weeks later than Ames, so for example Ames hits its first sub freezing around mid October and Davenport is toward the end of October.
Voting:
Good: 23
Bad: 4
Tags: winter

Has spring already started?
11 Mar 2011 03:40 PMA refreshing push of much warmer air make it into the state today and sure makes things feel much more like spring, but is the spring season actually here? If one thinks about winter as being the 91 (1/4 year) coldest days of the year, then perhaps spring has already arrived. The featured chart looks at the coldest (avg high+low) 91 day period for Ames and a fit line is placed on the end of the period. The fit would indicate that spring is coming a bit earlier than in the past. The colors of the bars represent the quartile of the average temperature for the winter season. A number of the bars push well into March, but the forecast for the next week looks very warm, so based on this metric, we are probably in spring now!
Voting:
Good: 11
Bad: 11
Tags: winter
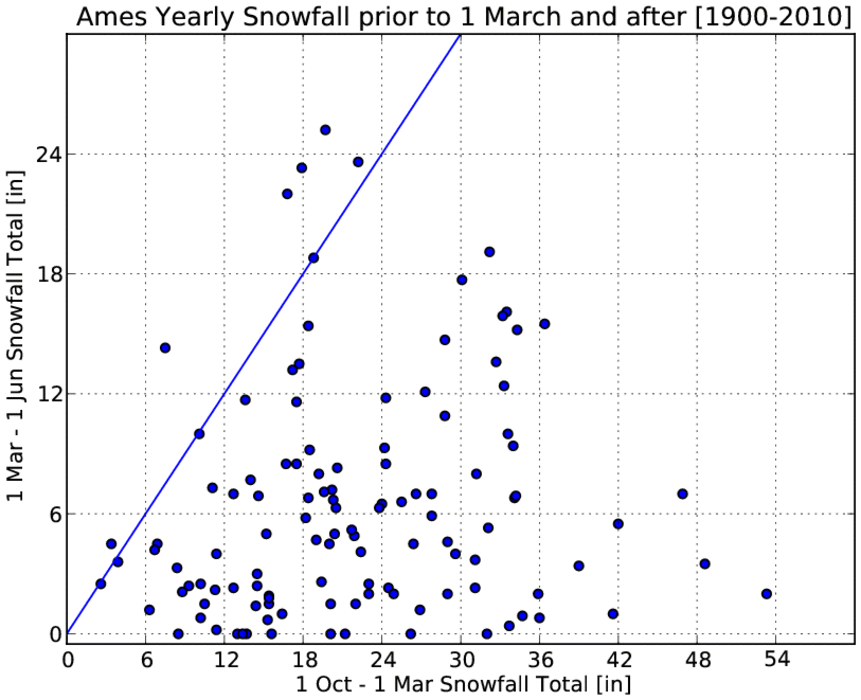
Plenty of time yet for snow
06 Mar 2011 05:50 PMWhile the lengthening days and warmer temperatures of March can make winter fell like it has gone away, the cold and snow of winter is still common in March. The featured chart presents the partitioning of yearly snowfall between dates prior to 1 March and those afterward. The 1to1 line shows that getter more snow after 1 March than before is rather uncommon, so our total so far of around 30 inches has little chance of being doubled this spring. Getting another 3-12 inches is common and the forecast this week looks to work on those totals with heavy snow possible in Iowa on Tuesday.
Voting:
Good: 17
Bad: 8
Tags: snow winter

Done with meteorological winter
01 Mar 2011 05:51 AMThe three months of the year known as meteorological winter are now in the books and preliminary data shows that high and low temperatures were below average for the period. The featured chart presents these averages and the last four winters have been on the cold side. But now we can focus on March and hopes for a warm spring! March will begin like a lamb with highs in the 40s today.
Voting:
Good: 18
Bad: 3
Tags: winter
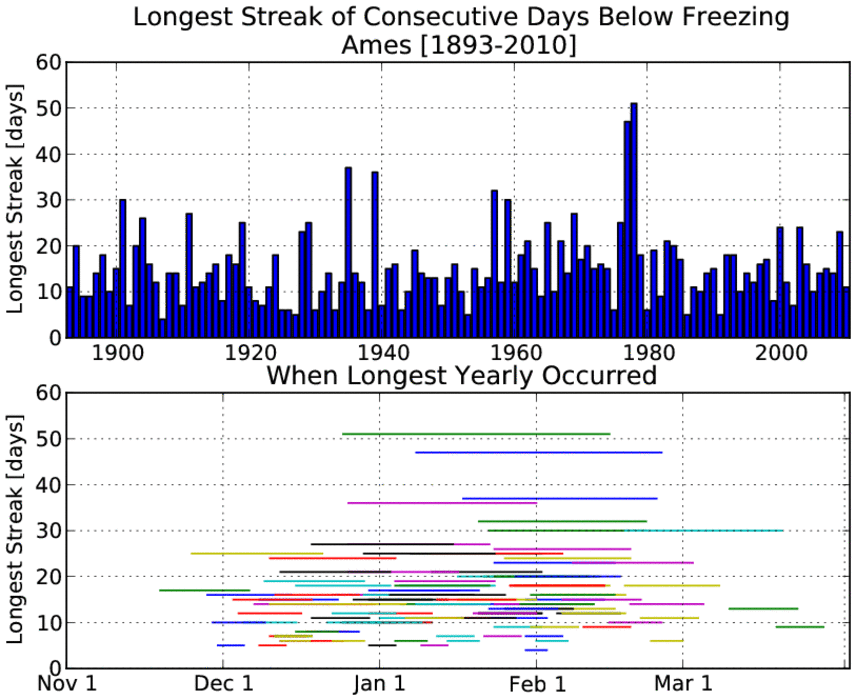
Streaks below freezing
28 Jan 2011 05:46 AMThe temperature finally broke freezing on Thursday ending a modest streak of 9 days below. Earlier in January, we had a streak of 11 days which is the longest such streak this winter season. The featured chart presents the longest consecutive day streak below freezing for each winter since 1893. As with other charts recently featured, the winters of 77 and 78 stand out. The bottom chart shows the period during which the streaks of various lengths occurred. There is an interesting streak of 30 days that lasted from late February to mid March (1960). There is certainly plenty more time for cold weather this winter!
Voting:
Good: 27
Bad: 11
Tags: winter freezing
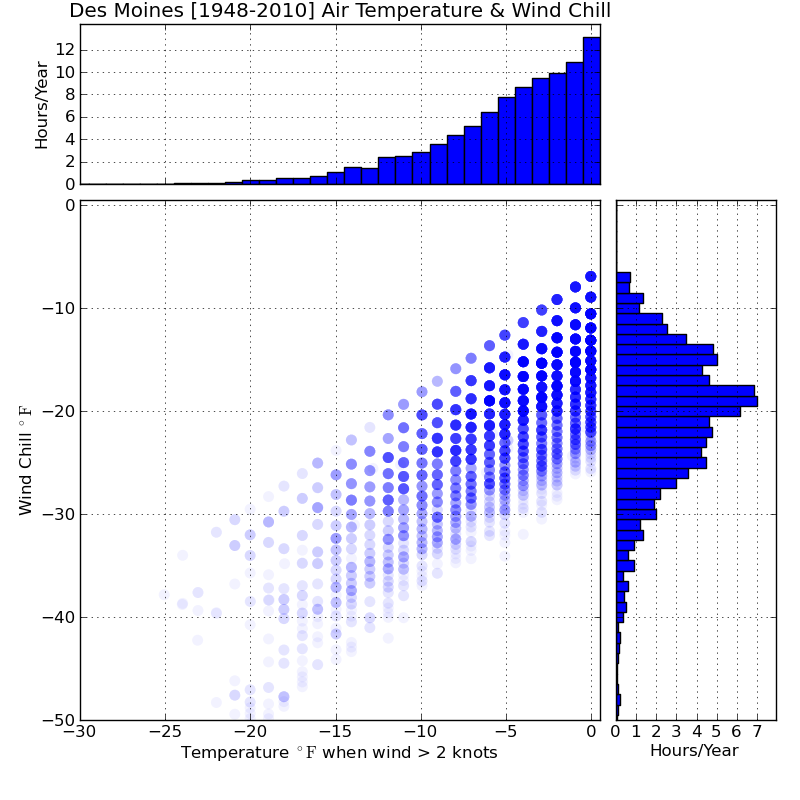
The wind and the cold
21 Jan 2011 07:04 AMVery cold temperatures and a bit of wind have conspired over night to bring bitterly cold wind chills to Iowa this Friday. The featured chart presents the reported wind chill against the air temperature during hours which the wind speed was measurable. Histograms of each are presented at the side and top. -20°F is roughly an observed threshold of wind chill where frequencies start declining at colder temperatures. Of course, the most extreme values are even more rare and often do not happen every year.
Voting:
Good: 44
Bad: 27
Tags: windchill winter
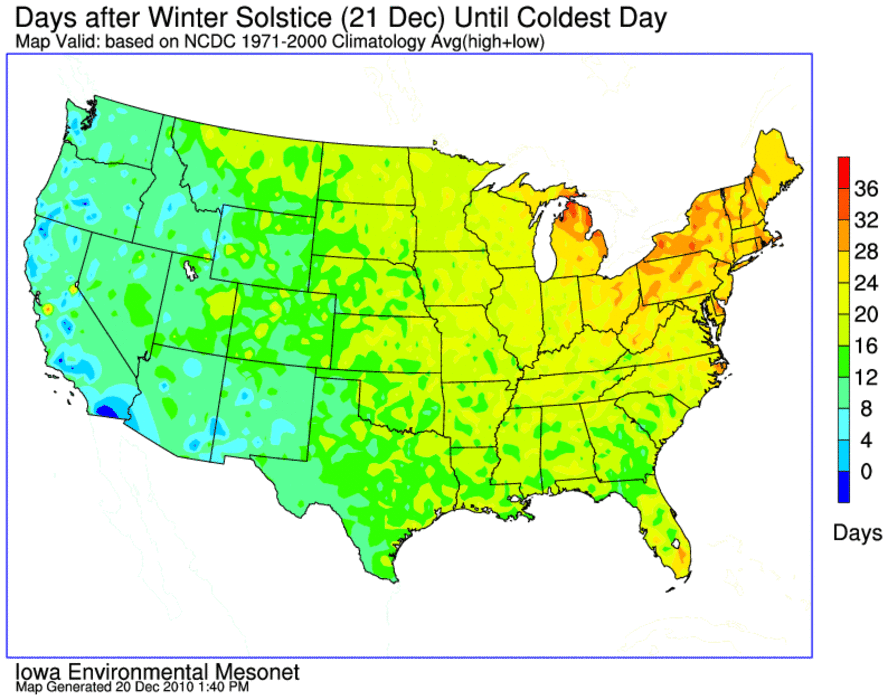
Shortest daylight isn't coldest
21 Dec 2010 05:46 AMToday is the winter solstice, when the daylight hours are the shortest for the year. Intuitively, one may expect this to be the coldest day of the year since it would have the least amount of sunshine. The featured map presents an analysis of the number of days after the solstice when the coldest day locally occurs. For Iowa, this works out being the middle of January. The east to west pattern over the United States is interesting as it takes a bit longer to cool the regions around the Great Lakes.
Voting:
Good: 24
Bad: 3
Tags: winter temp

When does winter start?
02 Dec 2010 05:48 AMWhile yesterday was the start of meteorological winter, the 21st is the start of the commonly defined winter season. If one considers winter a 91 day period with the coldest climatological temperatures, the actual start of winter is slightly before 1 December in Iowa. The feature map presents an IEM produced analysis of the start date of the coldest 91 consecutive day period based on climatology data. The map nicely shows the start of this period comes first for those in the western US and marches east with a ~4 week difference between the two. The coastal regions of California enjoy the moderating effects of the Pacific Ocean and appear to be the last to join the winter period.
Voting:
Good: 31
Bad: 4
Tags: winter temp

Another wet winter in store?
01 Dec 2010 05:47 AMToday starts the meteorological winter season and one wonders if it will be as wet as recent winters. The featured chart presents the range of reported winter season precipitation for Iowa (bars) along with the totals for Ames and the mean state wide value. Of course, when these precipitation amounts fall in the form of snow or ice, it makes for a much more difficult winter. The chart interestingly shows that most of the time (~ 70%), the precipitation total in Ames is lower than the state wide average. This is probably due to having more rainfall events clip southeast Iowa.
Voting:
Good: 31
Bad: 5
Tags: winter

Say goodbye to 70s?
09 Nov 2010 05:53 AMThe mercury hit 70 degrees for places like Des Moines yesterday. The featured chart presents the time period each year between the last fall and first spring observation of 70+ degrees for Des Moines. The average period is 142 days and periods longer than that are shown in blue. The forecast has us comfortably in the 60s today but cooler weather expected later this week. We could be saying goodbye to the 70s until March!
Voting:
Good: 15
Bad: 5
Tags: winter

Lets not add to these totals
02 Feb 2010 06:08 AMThe featured map displays the number of hours this winter under a blizzard warning according to unofficial IEM stored data. Iowa has certainly seen its share of blizzard conditions this winter with locations shown in red over 30 hours of blizzard warning time. Hopefully these totals are not added to for the rest of the winter and the immediate term forecast would indicate so. The real barometer of the duration of winter left will be checking his shadow later this morning.
Voting:
Good: 23
Bad: 5
Tags: winter
Is the worst behind us?
29 Jan 2010 06:11 AMThe featured chart looks at the cumulative probability that by a given date, the min low, min high or maximum snowfall has occurred for the winter season. For example, by Jan 28th the lowest high temperature for the season occurred 75% of the time prior to the date (meaning the coldest highs are hopefully behind us). It is interesting to note the slope of the maximum snowfall line and how the current value is around 40%. Big snowfalls are still possible, especially as we transition to spring (imagine that).
Voting:
Good: 77
Bad: 13
Tags: winter climate
Comparing winters
27 Jan 2010 06:10 AMWhile this has been a difficult winter for Iowa, how does it compare with past winters for the amount of winter we experience? While there is no one proper way to compute the misery for a winter, the featured graph shows a simple calculation of the total number of days for the winter below freezing and with snow cover (having both would count as 2 points) for Ames dating back to 1965. With this statistic, our recent few winters come up short compared with the winter of 2000-2001 and the winters of 1978 and 1979. Has this winter been the worst you have experienced? How do you quantify winter misery?
Voting:
Good: 21
Bad: 8
Tags: winter

Highs by category
04 Mar 2009 06:19 AMThe featured table presents the number of days that the high temperature was in a certain temperature range for meteorological winter (December, Januuary, and February). The year shown is the year of the December month of the period. This winter has seen its fair share of cold days and warm. It could have been worse like last year or even 1978. The chart also shows a few exceptional years in our recent past.
Voting:
Good: 27
Bad: 8
Tags: winter

Cold weather begets cold weather
23 Feb 2009 06:15 AMThe featured chart attempts to look at the frequency of having a second day of sub freezing high temperatures after a day below freezing. The red line represents the overall chance of having a below freezing high temperature. This plot would indicate that if a day was below freezing, it is likely (greater than 50% chance) that the next day would be below freezing. A warm up is expected this week before the next winter storm on Thursday.
Voting:
Good: 26
Bad: 13
Tags: winter
Sub Zero Wind Chills
03 Feb 2009 06:13 AMWind Chill values are again running well below zero this morning with a good portion of the state under a wind chill advisory. How often are wind chill values this cold? The featured table displays the number of hours exceeding certain temperature thresholds. This winter (shown as 2008) has seen 15 hours of sub -30F, which is at the simple historical average of 15 based on data back to 1973. The brutal winters of 1978 and 1983 are shown as well for comparison.
Voting:
Good: 20
Bad: 6
Tags: windchill winter

Quantify: "It has been a long winter"
13 Feb 2008 06:35 AMWhat makes this winter feel longer than others? There is no one way to prove this statement to be true, but we can sure compare this year to others. The featured chart shows the maximum consecutive days of having sub 50°F temperatures for Ames, which could be one way to quantify winter's apparent length. Most Iowans probably remember the brutal winter of 2000-2001, which was the longest streak. This winter is up to 86 days, which ranks just 26th in the climate history and 30 days longer than the average maximum winter streak. If you have any other ideas to quantify the statement, please let me know!
Voting:
Good: 22
Bad: 6
Tags: winter

Frequency of sub-zero
17 Jan 2008 06:27 AMThe big story of the current winter storm is not the snowfall, but the bitter cold temperatures and wind that will make today and Friday very dangerous to be outside. The featured graph shows the percentage of years in Ames's climate history that a certain threshold low temperature was exceeded. According to this plot, Ames has seen a sub -20 °F temperature in 40% of years during the Dec, Jan, and Feb months. Lows on Saturday are only expected to reach -10 °F, which is common just about every year.
Voting:
Good: 26
Bad: 3
Tags: winter